U.S. Energy Information Administration logo
Skip to sub-navigation
July 13, 2011

U.S. wind capacity takes off after 2005
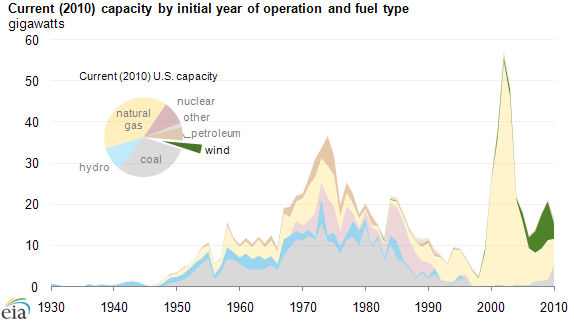
graph of Current (2010) capacity by initial year of operation and fuel type, as described in the article text
Source: U.S. Energy Information Administration, Form EIA-860 Annual Electric Generator Report, and Form EIA-860M (see Table ES3 in the March 2011 Electric Power Monthly)
Note: Data for 2010 are preliminary. Generators with online dates earlier than 1930 are predominantly hydroelectric. Data include non-retired plants existing as of year-end 2010. This chart shows the most recent (summer) capacity data for each generator. However, this number may change over time, if a generator undergoes an uprate or derate.
Download CSV Data

The June 16 edition of Today in Energy examined the wide age range of electric power generators for all fuels; today's article looks specifically at wind generators. From 2005 to 2009, the annual growth in U.S. wind capacity averaged 40%. Since 2006, 36% of total electric power industry capacity additions have been wind generators. The economic downturn and an uncertain regulatory environment (particularly relating to the renewal of production and investment tax credits) contributed to a lower level of wind capacity additions in 2010.
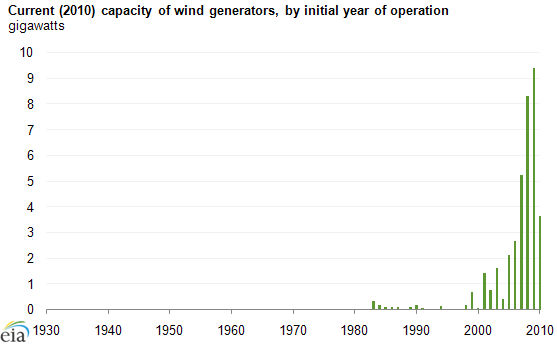
graph of Current (2010) capacity by initial year of operation
Source: U.S. Energy Information Administration, Form EIA-860 Annual Electric Generator Report, and Form EIA-860M (see Table ES3 in the March 2011 Electric Power Monthly)
Note: Data for 2010 are preliminary. Generators with online dates earlier than 1930 are predominantly hydroelectric. Data include non-retired plants existing as of year-end 2010. This chart shows the most recent (summer) capacity data for each generator. However, this number may change over time, if a generator undergoes an uprate or derate.
Download CSV Data

Recent wind development is driven by State-level renewable portfolio standards (or similar legislation), as well as a Federal production tax credit and grants. While wind power is attractive due to its lack of emissions and low operating costs, its intermittency and sudden changes in production create challenges for grid operators and planners.


Statistics
Analysis
Tools
Education
News

Petroleum & Other Liquids

Crude oil, gasoline, heating oil, diesel, propane, and other liquids including biofuels and natural gas liquids.

Natural Gas

Exploration and reserves, storage, imports and exports, production, prices, sales.

Electricity

Sales, revenue and prices, power plants, fuel use, stocks, generation, trade, demand & emissions.

Coal

Reserves, production, prices, employment and productivity, distribution, stocks, imports and exports.

Nuclear & Uranium

Uranium fuel, nuclear reactors, generation, spent fuel.

Renewable & Alternative Fuels

Includes hydropower, solar, wind, geothermal, biomass and ethanol.

EIA Survey Forms

Forms EIA uses to collect energy data including descriptions, links to survey instructions, and additional information.

Total Energy

Comprehensive data summaries, comparisons, analysis, and projections integrated across all energy sources.

U.S. States

State energy information, including overviews, rankings, data, and analyses.

International

International energy information, including overviews, rankings, data, and analyses.

Environment

Greenhouse gas data, voluntary reporting, electric power plant emissions.

Data Tools, Apps, & Maps

Tools to customize searches, view specific data sets, study detailed documentation, and access time-series data.

Open Data

EIA's free and open data available as API, Excel add-in, bulk files, and widgets

EIA Beta

Come test out some of the products still in development and let us know what you think!

Open Source Code

EIA's open source code, available on GitHub.

RSS Feeds

Subscribe to feeds for updates on EIA products including Today in Energy and What's New.