
U.S. refinery capacity reaches 18 million barrels per day
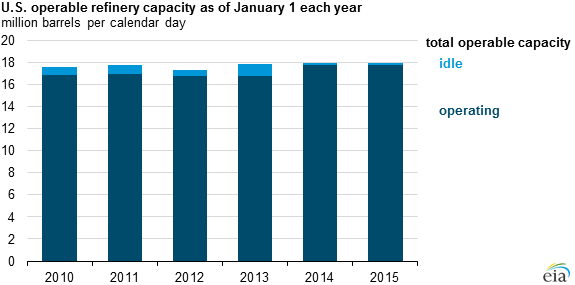
Increased refinery runs—based on increases in both capacity and utilization—have helped accommodate increases in U.S. crude oil production. The United States' capacity to refine crude oil into petroleum products—measured as operable atmospheric crude distillation unit (CDU) capacity—increased by 0.2% in 2014, reaching 18.0 million barrels per calendar day (b/d), according to EIA's recently released annual Refinery Capacity Report.
The refinery capacity reported for the beginning of 2015 includes expansions that were operable on January 1, but not necessarily operating. Because these units were not operating as of January 1, capacity for those projects is listed as idle. Dakota Prairie Refining recently completed construction of one of the few new refineries built in the United States over the past 30 years. This relatively simple refinery, which is located in western North Dakota, has CDU capacity of 19,000 b/d and will refine locally produced crude oil to make diesel fuel. Earlier this year, Kinder Morgan added a 42,000 b/d condensate splitter to its Galena Park, Texas crude oil terminal that is also included in the capacity estimate for the start of 2015. A second unit, with similar capacity, is expected to start operating this summer, but it is not included in the January 1, 2015 capacity estimate.
U.S. refinery capacity and utilization have increased to accommodate increasing domestic crude oil production, which rose to an average 8.7 million b/d in 2014, 3.2 million barrels higher than in 2010. Gross inputs to refineries averaged a record 16.1 million b/d in 2014 compared with 15.1 million b/d in 2010. Nearly 75% of the 1.0 million b/d increase in refinery gross inputs is the result of a 4 percentage point increase in refinery utilization compared with 2010 (from 86% to 90%). The rest of the increase is attributable to capacity expansions. Over the same period, crude imports decreased by 1.9 million b/d, and crude exports increased by 0.3 million b/d.
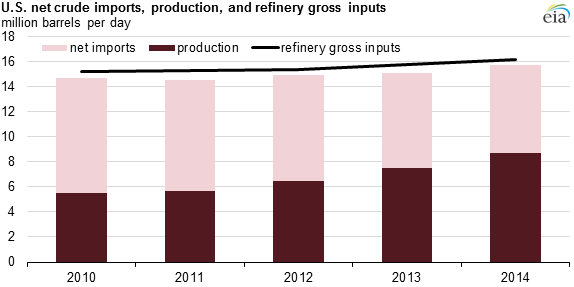
Note: Refinery gross inputs include crude oil and other oils processed through crude distillation units.
The report also includes information on expansions planned for the remainder of 2015. Capacity is expected to expand by an additional 119,000 barrels per stream day later in 2015. Delek US plans to increase CDU capacity by 10,000 b/d at its Tyler, Texas refinery, and Marathon reported that it plans to add 35,000 b/d of condensate splitter capacity at its Catlettsburg, Kentucky refinery by the end of the year. Further investment in refinery expansion projects will depend on expectations of relative crude oil prices and the relative economic advantage of the U.S. refining fleet compared with refineries in the rest of the world.
EIA's Refinery Capacity Report measures refinery capacity in barrels per stream day and barrels per calendar day. Barrels per stream day reflects the maximum number of barrels of input that a distillation facility can process within a 24-hour period when running at full capacity under optimal crude oil and product slate conditions with no allowance for downtime. Barrels per calendar day is a measure of the amount of input that a distillation unit can process in a 24-hour period under usual operating conditions and maintenance downtime. Stream day capacity is typically about 6% higher than calendar day capacity.
Principal contributors: Hannah Breul, Julie Harris