
Levelized cost comparisons help explain value of various electric generation technologies
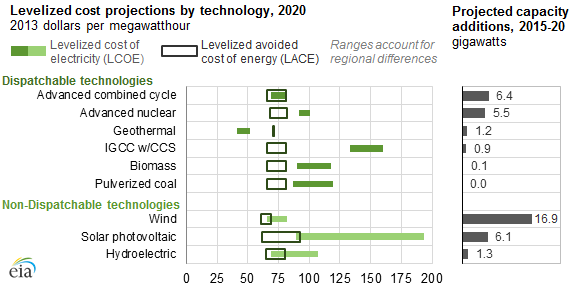
Note: Costs reflect utility-scale systems and include federal tax incentives for renewables as applicable in 2020 under current law. IGCC is integrated gasification combined cycle; CCS is carbon capture and sequestration. Capacity additions reflect electric power sector additions only, and include planned capacity already under construction as well as projected model builds.
When power plants are built, several factors influence the choice of fuels and technologies that will ultimately generate electricity. Cost is one of the most difficult factors to compare, as technologies can have vastly different capital, fuel, maintenance, and financing costs, as well as different utilization rates and access to fuel resources. Two measures, the levelized cost of electricity (LCOE) and the levelized avoided cost of electricity (LACE), are widely used to make cost comparisons across technologies.
LCOE represents the per-kilowatthour cost of building and operating a generating plant over an assumed financial life and activity level (e.g., baseload, peaking, seasonal). Key inputs used to calculate LCOE include capital costs, fuel costs, fixed and variable operations and maintenance (O&M) costs, financing costs, and an assumed utilization rate for each plant type. These costs can vary by region and over time.
For example, technologies such as solar and wind have no fuel costs for generation and relatively small variable O&M costs, so their LCOE is mostly determined by capital costs and financing costs. Capital costs include things such as plant installation, labor, and grid-interconnection; financing costs are the costs of servicing the debt incurred during the lifetime of the plant. For generators that consume fuels such as coal and natural gas, both fuel costs and capital cost significantly affect LCOE.
LCOE values may also vary across regions because of differences in construction, fuel, and transmission costs, as well as differences in the quality of resource available for certain renewables such as solar and wind.
There are some attributes that LCOE does not capture, such as environmental considerations and grid operation constraints for maintaining system reliability. System reliability can be important, as some technologies are not dispatchable, meaning they cannot generate electricity on command at any time of day.
LACE, a different but related concept, represents the value to the electric grid (measured in per-kilowatt-hour terms) of adding generating capacity using a specific technology to the system. LACE reflects the cost that would be incurred to provide the same supply to the system if new capacity using that specific technology was not added. A technology is generally considered economically competitive when its LACE exceeds its LCOE.
Comparisons between the LCOEs of different technologies will not necessarily provide a good indicator of their economic competitiveness. This is clearly evident where new capacity using one technology competes against an existing plant using another technology. Because the cost of the existing plant has already been incurred, the new capacity addition will increase system cost unless its LCOE is lower than the operating cost (fuel and maintenance) of the existing plant. Many existing plants that were expensive to build but are cheap to operate, such as large coal and nuclear plants, can therefore be very economically competitive even though the LCOE for new plants of these types may be higher than the LCOE for other technologies.
Even when two new plants using different technologies are compared, LCOE may not account for differences in the services that each technology provides to the grid. For example, coal, nuclear, and natural gas combined-cycle plants all provide baseload services to the grid, and thus all have very similar LACE values, even where their LCOE values differ. In some regions, wind plants often provide higher output during the night when the demand for and the value of electricity is typically low. Wind plants also provide energy intermittently, and they cannot be ramped up and down by system operators to follow demand patterns. For these reasons, in a situation where wind has a similar LCOE to a combined-cycle plant, it typically provides less value to the system, as measured by LACE. Solar plants tend to produce most of their energy during the middle of the day, when the demand for and the value of electricity is higher, resulting in a higher LACE.
As part of the analysis that determines capacity additions in the Annual Energy Outlook 2015, EIA calculates LCOE and LACE for multiple technologies on an annual basis through 2040 in 22 regions of the country. These calculations are available in the full Levelized Cost and Levelized Avoided Cost of New Generation Technologies in the Annual Energy Outlook 2015 report.
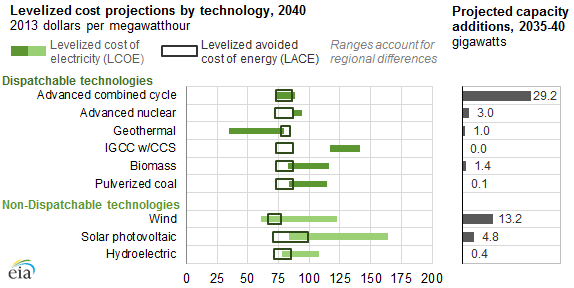
Note: Costs reflect utility-scale systems and include federal tax incentives for renewables as applicable in 2040 under current law. IGCC is integrated gasification combined cycle; CCS is carbon capture and sequestration. Capacity additions reflect electric power sector additions only.
Principal contributor: Danielle Lowenthal-Savy, Christopher Namovicz