
U.S. retail gasoline prices fall as Labor Day approaches
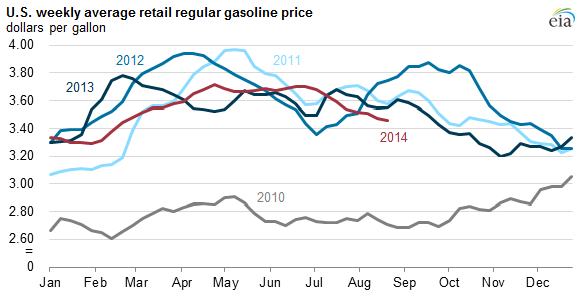
The U.S. average retail price for regular gasoline was $3.45/gallon (gal) on August 25, the lowest price on the Monday before Labor Day since 2010. The average price at the pump is now $0.25/gal lower than it was at the end of June. Lower North Sea Brent crude oil prices are the main driver of the decline in gasoline prices; the current Brent price is lower than it was last month, and lower than it was on Labor Day weekend last year.
The recent decline in gasoline prices largely reflects changes in crude oil prices. In June of this year, the Brent spot price reached its year-to-date high of $115/barrel (bbl), then fell to $102/bbl on August 22. Current Brent prices are below their August average level over the past three years, which ranged between $110/bbl and $113/bbl. Crude oil prices were lower in 2010, as the global economy was just beginning to recover from the 2008-09 recession that reduced oil demand.
The recent decreases in the Brent spot price likely reflect the market's perception of reduced risk for Iraqi oil exports as well as reports of increasing Libyan oil exports. Additionally, some economic indicators released over the summer suggest that global demand growth may be weaker than expected. Finally, the end of the third quarter and early fourth quarter mark the autumn maintenance season for refineries, and reduced crude buying ahead of maintenance is likely putting some downward pressure on prices.
Regional retail gasoline prices in the United States vary significantly. Prices are lowest on the Gulf Coast ($3.24/gal) and highest on the West Coast ($3.83/gal) as of August 25. Gulf Coast prices are often low compared with prices in other regions because of the Gulf Coast's proximity to half the nation's refining capacity—its gasoline production is greater than the region's consumption—and because it does not rely on supply transferred from other U.S. regions or imported from the global market. West Coast prices are often higher than those in other areas of the country because of the more restrictive gasoline specifications in California, the region's dominant market. As of August 25, prices in the Rocky Mountains region and East Coast averaged $3.65/gal and $3.40/gal, respectively.
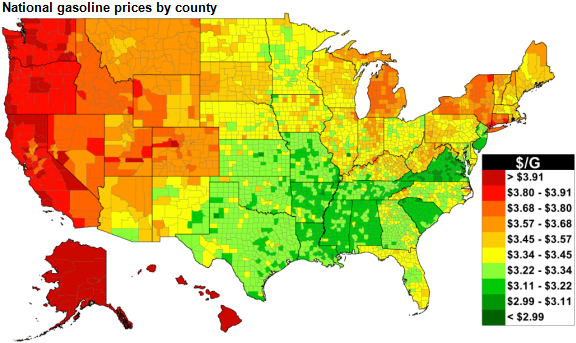
Note: Prices are as of August 28.
In its August Short-Term Energy Outlook, EIA forecasts that the U.S. average retail price of gasoline will decline modestly through the end of the year, reaching a monthly average low of $3.30/gal in December. Gasoline prices often fall after Labor Day as seasonal demand wanes and as the market shifts to winter fuel specifications, which make greater use of low-cost fuel components. However, unplanned refinery outages or unanticipated Brent crude oil price increases add uncertainty to EIA's forecast and could result in higher-than-expected gasoline prices.
Principal contributors: EIA staff