
Investment in electricity transmission infrastructure shows steady increase
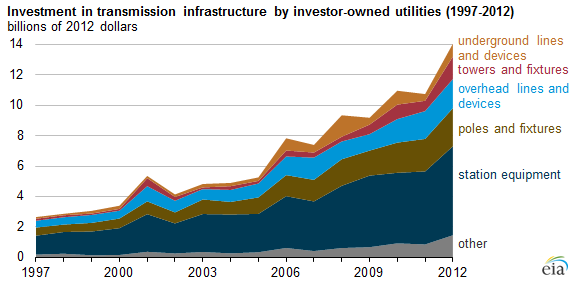
There has been a five-fold increase in new electricity transmission investment in the United States by major investors and privately owned companies during the 15 years from 1997 to 2012. The investment increased from $2.7 billion in 1997 to $14.1 billion in 2012—reversing a three-decade decline.
The first major wave of electricity transmission investment ended in the late 1960s. It began with electrification in the early 1900s and was driven by increased use of new transmission technology, the growing use of large central station generating plants to serve large areas, and growing electricity demand following World War II. From then until the mid-1990s, investment in transmission infrastructure declined. It has increased since then for several reasons:
- Improving reliability. In mid-August 2003, an electric power blackout lasted up to four days in parts of the U.S. Northeast and Midwest and in Canada, adversely affecting 50 million people and shutting down 62 gigawatts of electric load. The blackout cost an estimated $4 billion to $10 billion in economic losses due to food spoilage, lost production, overtime wages, and powerline damages. In response to the need for a more reliable system, Congress passed legislation in 2005 that directed the Federal Energy Regulatory Commission (FERC) to develop incentive-based rate treatments for interstate transmission.
- Connecting to renewable energy sources. Policies and incentives such as state renewable portfolio standards and renewable energy tax credits, combined with a substantial decrease in the cost to build large-scale wind turbines, led to tremendous growth in wind generation—from 4 million MWh in 1999 to 141 million MWh in 2012. Utility-scale solar generation also increased in this period. Because the best areas for wind and solar generation are often far from load centers, new transmission infrastructure was built to accommodate these renewable electricity generators.
- Accommodating changes in electricity demand. Although overall electricity retail sales have not grown much in recent years—less than 1% annually from 1997 through 2012—the location of that demand has changed. Population shifts require new investment in growing areas, and the areas with greater growth have been in the South and West, where demand for air conditioning is higher.
- Increasing costs to build new transmission. The global economic boom of 2004-07, along with a weakened U.S. dollar, raised the prices of raw materials (such as steel and cement), fuel, and labor faster than the rate of inflation. This further increased expenditures for transmission improvements, especially on large station equipment such as transformers and transmission towers, which were in high demand as the number of transmission projects increased.
- Reforming markets. Electricity wholesale and retail market restructuring since 1998 led regional transmission organizations to upgrade and build more transmission infrastructure. This restructuring allowed utilities more flexibility to purchase less expensive power from nonutility generators and suppliers located outside their service territories.
Although the data above reflect investor and privately owned utilities, there have also been noticeable increases in transmission investment by cooperative utilities—from $296 million in 1997 to $892 million by 2011. Spending by government-owned utilities such as federal and municipal utilities on new transmission increased from $852 million in 1997 to $1.3 billion in 2003. Data since 2003 are not available.
Principal contributor: Lori Aniti
Tags: electricity, transmission