U.S. Energy Information Administration logo
Skip to sub-navigation
August 6, 2014

EIA mapping tool shows which U.S. energy facilities are in areas at risk of flooding
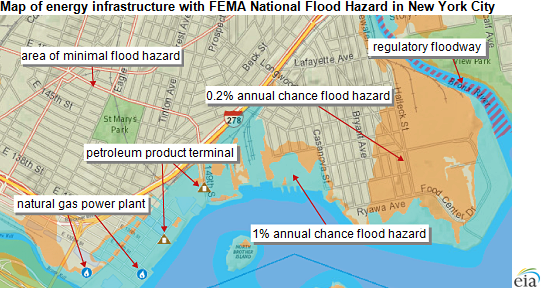
image of EIA flood mapping tool, as explained in the article text
Source: U.S. Energy Information Administration

A new component of EIA's Energy Mapping System allows users to view critical energy infrastructure that may be vulnerable to coastal and inland flooding. These new map layers enable the public to see existing energy facilities that could potentially be affected by flooding caused by hurricanes, overflowing rivers, flash floods, and other wet-weather events.

The mapping tool combines flood hazard information from the Federal Emergency Management Agency (FEMA) with EIA's existing U.S. Energy Mapping System that shows power plants, oil refineries, crude oil rail terminals, and other critical energy infrastructure. The maps can help readers understand what energy infrastructure assets are currently exposed to flood risk.

The maps show areas that have a 1% and 0.2% annual chance of flooding (essentially a 1-in-100 and 1-in-500 chance, respectively). The tool also contains regulatory floodways, levees, areas with levees (and therefore reduced flood risk), and areas with conditions that might be identified in the future as having a 1% annual flood hazard. To determine if a specific area is vulnerable to flooding, users can input an address, town, or county name and see street-level results. They also can zoom in on areas of the United States highlighted with flood hazard information.
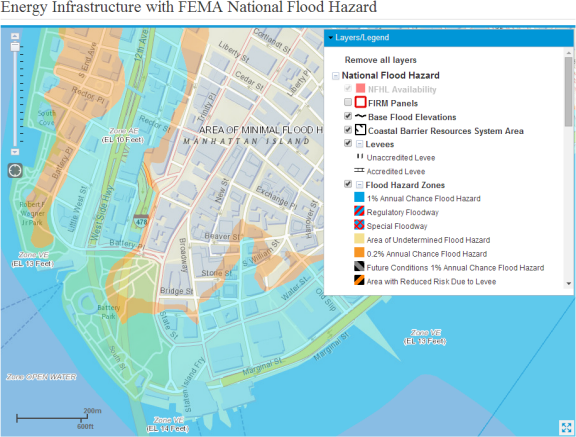
image of EIA flood mapping tool, as explained in the article text
Source: U.S. Energy Information Administration
Note: See the interactive map.

Principal contributors: Tom Doggett, John Krohn

Tags: weather

Statistics
Analysis
Tools
Education
News

Petroleum & Other Liquids

Crude oil, gasoline, heating oil, diesel, propane, and other liquids including biofuels and natural gas liquids.

Natural Gas

Exploration and reserves, storage, imports and exports, production, prices, sales.

Electricity

Sales, revenue and prices, power plants, fuel use, stocks, generation, trade, demand & emissions.

Coal

Reserves, production, prices, employment and productivity, distribution, stocks, imports and exports.

Nuclear & Uranium

Uranium fuel, nuclear reactors, generation, spent fuel.

Renewable & Alternative Fuels

Includes hydropower, solar, wind, geothermal, biomass and ethanol.

EIA Survey Forms

Forms EIA uses to collect energy data including descriptions, links to survey instructions, and additional information.

Total Energy

Comprehensive data summaries, comparisons, analysis, and projections integrated across all energy sources.

U.S. States

State energy information, including overviews, rankings, data, and analyses.

International

International energy information, including overviews, rankings, data, and analyses.

Environment

Greenhouse gas data, voluntary reporting, electric power plant emissions.

Data Tools, Apps, & Maps

Tools to customize searches, view specific data sets, study detailed documentation, and access time-series data.

Open Data

EIA's free and open data available as API, Excel add-in, bulk files, and widgets

EIA Beta

Come test out some of the products still in development and let us know what you think!

Open Source Code

EIA's open source code, available on GitHub.

RSS Feeds

Subscribe to feeds for updates on EIA products including Today in Energy and What's New.