U.S. Energy Information Administration logo
Skip to sub-navigation
March 11, 2014

Growth in U.S. hydrocarbon production from shale resources driven by drilling efficiency
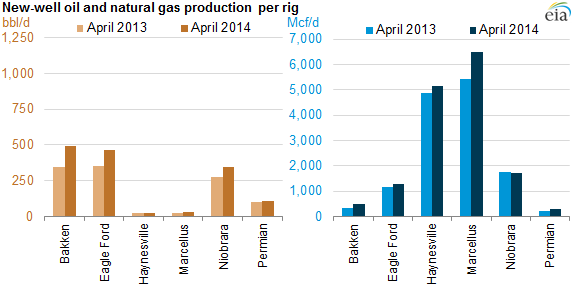
graph of new well production per rig, oil and natural gas, as explained in the article text
Source: U.S. Energy Information Administration, March 2014 Drilling Productivity Report

The productivity of oil and natural gas wells is steadily increasing in many basins across the United States because of the increasing precision and efficiency of horizontal drilling and hydraulic fracturing in oil and natural gas extraction. Many resource-producing basins are experiencing an increasing yield over time in either oil (Bakken, Eagle Ford, Niobrara) or natural gas (Marcellus, Haynesville).

The geology of each oil and natural gas resource play is diverse, and individual rig or well performance can vary dramatically. However, drilling activity in U.S. shale plays is now generally producing greater quantities of oil and/or natural gas than in the past.

As noted in March's productivity report, five of the six U.S. shale plays tracked by the DPR have seen increases in oil and natural gas production per rig over the past few years. According to EIA's March DPR, the Eagle Ford Shale is leading in increased production of oil per rig, and the Marcellus Shale is leading in increased production of natural gas per rig.
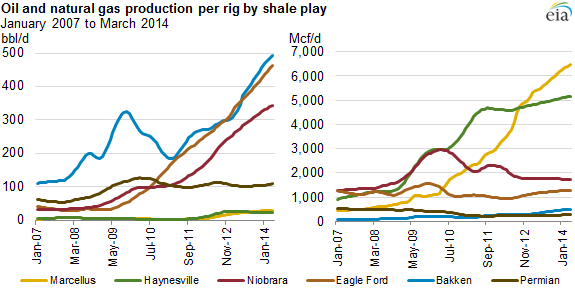
graph of oil and natural gas production per rig by shale play, as explained in the article text
Source: U.S. Energy Information Administration, March 2014 Drilling Productivity Report

DPR data show that each drilling rig in the Eagle Ford Shale will contribute over 400 barrels of oil per day (bbl/d) more in April 2014 than it would have in the same formation in January 2007. At the same time, the DPR also shows that a Marcellus Shale well completed by a rig in April 2014 can be expected to yield over 6 million cubic feet of natural gas per day (Mcf/d) more than a well completed by that rig in that formation in 2007.

This trend of increasing rig productivity is one factor helping to increase the nation's oil and natural gas production. The latest Annual Energy Outlook forecasts that U.S. oil production will reach 9.6 million barrels per day in 2019, and natural gas production will increase by 56% through 2040.

Principal contributors: John Krohn, Mike Ford

Statistics
Analysis
Tools
Education
News

Petroleum & Other Liquids

Crude oil, gasoline, heating oil, diesel, propane, and other liquids including biofuels and natural gas liquids.

Natural Gas

Exploration and reserves, storage, imports and exports, production, prices, sales.

Electricity

Sales, revenue and prices, power plants, fuel use, stocks, generation, trade, demand & emissions.

Coal

Reserves, production, prices, employment and productivity, distribution, stocks, imports and exports.

Nuclear & Uranium

Uranium fuel, nuclear reactors, generation, spent fuel.

Renewable & Alternative Fuels

Includes hydropower, solar, wind, geothermal, biomass and ethanol.

EIA Survey Forms

Forms EIA uses to collect energy data including descriptions, links to survey instructions, and additional information.

Total Energy

Comprehensive data summaries, comparisons, analysis, and projections integrated across all energy sources.

U.S. States

State energy information, including overviews, rankings, data, and analyses.

International

International energy information, including overviews, rankings, data, and analyses.

Environment

Greenhouse gas data, voluntary reporting, electric power plant emissions.

Data Tools, Apps, & Maps

Tools to customize searches, view specific data sets, study detailed documentation, and access time-series data.

Open Data

EIA's free and open data available as API, Excel add-in, bulk files, and widgets

EIA Beta

Come test out some of the products still in development and let us know what you think!

Open Source Code

EIA's open source code, available on GitHub.

RSS Feeds

Subscribe to feeds for updates on EIA products including Today in Energy and What's New.