
Dollar value of natural gas net imports has declined dramatically in recent years
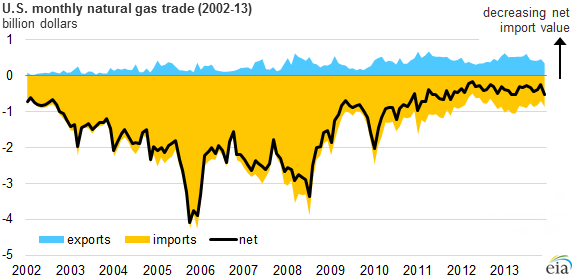
Natural gas trade flows are much lower, in terms of both monetary value and energy content, than trade flows associated with crude oil and petroleum products, as discussed in a previous article on energy trade. However, the value of U.S. natural gas net trade flows has experienced large percentage declines in recent years, because both the price and net volume of natural gas imports have been declining for several years.
In 2012, the value of U.S. natural gas imports via pipeline reached its lowest level since 1995. Net pipeline import volumes in 2013 were 7% lower than in 2012. However, because natural gas prices have increased relative to their 2012 low point, the value of net natural gas imports via pipelines rose in 2013. When accounting for the 34% decrease in the dollar value of U.S. liquefied natural gas (LNG) imports between 2012 and 2013, however, the dollar value of natural gas net imports in 2013 actually declined 14% compared to 2012.
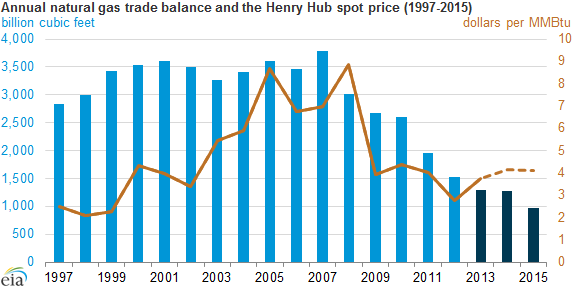
Note: Data for 2013-15 are from the February issue of the Short-Term Energy Outlook.
While both domestic oil and natural gas production are currently on the upswing, the boom in natural gas production from shale resources began in 2005, well ahead of the upturn in tight oil production. The decline in value of net imports of natural gas is particularly noteworthy, given that the volume of U.S. natural gas consumption has been increasing since 2005, in contrast to the consumption of oil, which has been flat or declining since the middle of the past decade.
Unlike oil prices, which are largely determined on a world market, current domestic natural gas prices reflect the balance between supply and demand for natural gas in North America, which is dominated by production and consumption trends in the United States. For several years, natural gas prices in North America have ranged substantially below those in Asia and Europe, which has encouraged plans for the development of capacity to produce LNG for shipments to overseas markets.
This difference in domestic versus international prices is in part explained by transportation costs. Unlike petroleum, which can be shipped across oceans with relatively low costs, both the liquefaction and shipping of natural gas involve significant capital and energy costs. Because of this difference, global natural gas prices are less likely to converge to the same extent as global oil prices.
As LNG export capability grows and as the United States continues to reduce its net imports of natural gas via pipelines from Canada and increase its net exports of natural gas via pipeline to Mexico, the Reference case projections in EIA's 2014 Annual Energy Outlook show the United States becoming a net exporter of natural gas in both value and volume terms later this decade.
Principal contributors: Robert McManmon, Michael Ford