
Natural gas generation lower than last year because of differences in relative fuel prices
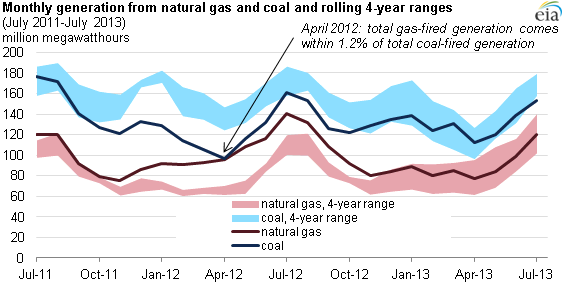
Note: The rolling 4-year range for each fuel source represents the maximum and minimum amount of each fuel source that is consumed for electricity generation for the same month during the previous four years.
Total natural gas use for power generation in the United States was down 14% during the first seven months of 2013 compared to the same period in 2012 (see chart), mostly because of higher natural gas prices relative to coal prices. High natural gas-fired generation in 2012 occurred as a result of the lowest spot natural gas prices in a decade—in fact, the two fuels contributed approximately equal shares of total generation in April 2012. Despite lower gas use for generation thus far in 2013, natural gas generation remains consistently higher than levels before 2012, as shown in the graphs below.
Trends in natural gas use for power vary by region because of differences in the availability of generating plants, generating plant age and efficiency, and the relative cost of fuels to operate power plants. While natural gas prices in most parts of North America are fairly uniform, the availability and cost of coal varies more by region. In addition, coal transport costs can reflect a high portion of the overall cost of delivered fuel. In some regions, such as the Southeast and Mid-Atlantic, natural gas use for power is significantly lower in 2013. This larger drop is because natural gas made greater inroads in 2012 compared to regions like Texas where low natural gas prices in 2012 did not displace nearly as much coal-fired generation. Fuel competition is less intense in parts of the country where coal fuels a very small portion of the generation or where the delivered coal price is extremely low, resulting in relatively greater coal consumption.
The analyses below show both national and regional trends in natural gas use for power by comparing generation to average daily temperatures. Isolating the influence of weather on natural gas use for power generation allows other factors, such as the price of natural gas relative to coal discussed above, to be more readily apparent.
Source: U.S. Energy Information Administration, based on Bentek Energy LLC
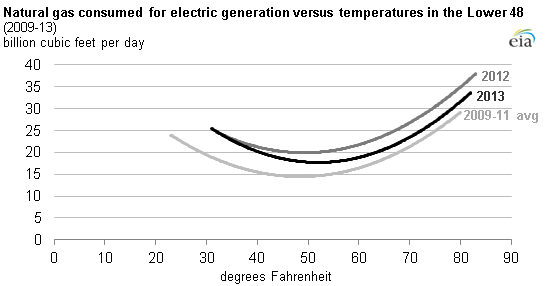
Note: Lines for each year reflect the best-fit second-order polynomial equation, based on the relationship between temperature and natural gas consumption for power burn. Line for 2009-2011 reflects observations for three-year averages for all 365 calendar days.
Gas use for power generation in the United States has generally risen since 2008. The increasing gas use for power is a structural change that is occurring across a wide range of temperatures and seasons. Several factors underpin this trend, including moderate natural gas prices, increased shale gas production, and additions of natural gas generating capacity.
In 2013, natural gas use for power was down compared with 2012 levels, mainly because of higher natural gas prices. This reduction generally occurred for average daily temperatures between 40 and 80 degrees Fahrenheit, when power demand rose to levels that induced power companies to base the composition of their additional generation to meet this higher demand on relative fuel costs.
Source: U.S. Energy Information Administration, based on Bentek Energy LLC
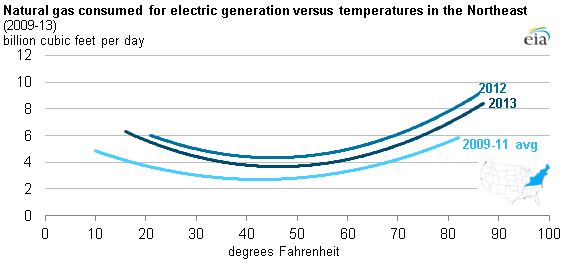
Note: Lines for each year reflect the best-fit second-order polynomial equation, based on the relationship between temperature and natural gas consumption for power burn. Line for 2009-2011 reflects observations for three-year averages for all 365 calendar days.
This Northeast region, which includes Ohio, Kentucky, West Virginia, Pennsylvania, and states in New England and parts of the Mid-Atlantic, experienced a high degree of coal-to-gas substitution in power generation in 2012. Growing supplies of Marcellus natural gas are increasingly competing with relatively high-cost Central Appalachia (CAPP) coal.
As natural gas prices increased between 2012 and 2013, natural gas-fired generation decreased, but it remained above the 2009-11 average throughout nearly the entire temperature range.
Source: U.S. Energy Information Administration, based on Bentek Energy LLC
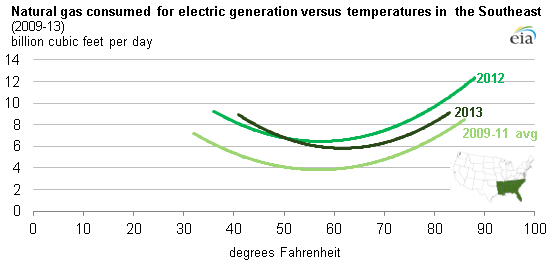
Note: Lines for each year reflect the best-fit second-order polynomial equation, based on the relationship between temperature and natural gas consumption for power burn. Line for 2009-2011 reflects observations for three-year averages for all 365 calendar days.
The Southeast was a key market for coal-to-gas substitution in 2012. At times, natural gas generating units even displaced more-efficient coal plants consuming Powder River Basin coal.
The amount of natural gas burned for electric generation was sharply lower in 2013 compared to 2012 at average daily regional temperatures above 60 degrees Fahrenheit. However, natural gas use for power in 2013 remains above the 2009-11 average for all temperatures.
Source: U.S. Energy Information Administration, based on Bentek Energy LLC
Note: Lines for each year reflect the best-fit second-order polynomial equation, based on the relationship between temperature and natural gas consumption for power burn. Line for 2009-2011 reflects observations for three-year averages for all 365 calendar days.
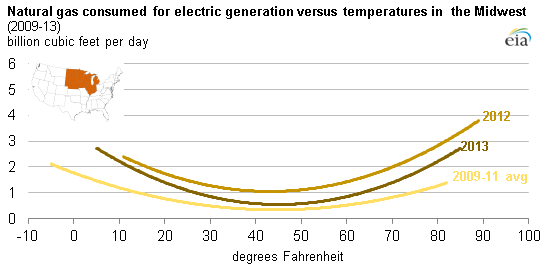
Coal produced in the Midwest is generally cheaper than coal produced in the Southeast, but it is more expensive than coal produced farther west. The degree to which coal and gas compete for electric generation in this region is generally greater than in states to the west, but less than in the CAPP coal-consuming regions. Its coal mix is primarily from the relatively expensive Northern Appalachia (NAPP) coal and the mid-range priced Illinois Basin coal, whose production levels have been increasing over the past few years, in addition to Powder River Basin coal.
This coal-dominated region also saw some natural gas units displace coal generation when spot natural gas prices were extremely low in spring 2012.
Because of higher natural gas prices in 2013, natural gas consumed for power generation has been lower than in 2012 at almost all temperatures between 25 and 75 degrees Fahrenheit.
Source: U.S. Energy Information Administration, based on Bentek Energy LLC
Note: Lines for each year reflect the best-fit second-order polynomial equation, based on the relationship between temperature and natural gas consumption for power burn. Line for 2009-2011 reflects observations for three-year averages for all 365 calendar days.
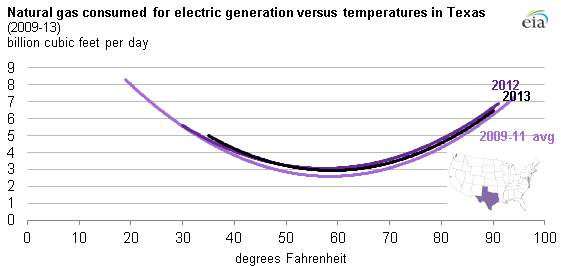
Unlike types of coal used in the Northeast, Southeast, and Midwest regions, the coal mix in Texas consists of significantly cheaper varieties, including locally mined low-grade lignite, as well as larger volumes of Powder River Basin (PRB) and Uinta Basin coal. Coal from these basins is significantly less expensive than coal from other U.S. supply sources and has lower transport costs compared with the costs of longer haul deliveries to the Mid-Atlantic and Southeast.
Compared with other regions in the United States, natural gas use for power generation has not fallen as much in 2013 compared to 2012. As gas prices increased between April 2012 and April 2013, gas-fired power did not decline significantly in 2013 below 2012 levels, since it was not competing with that region's relatively lower-cost coal-fired generation to the same degree as in other regions..
Principal contributor: Mike Ford
Tags: coal, generation, natural gas, prices