
Rapid increases in electricity demand challenge both generating unit and system operators
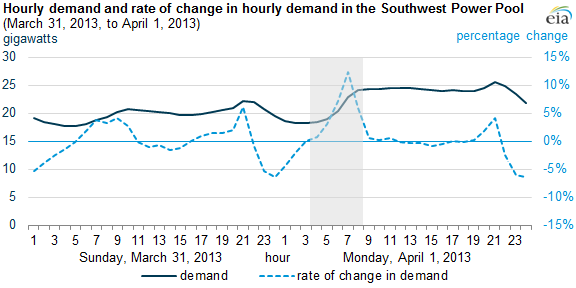
Because supply and demand for electricity must balance in real-time, rapid changes in demand create operational challenges for the electric system and generating unit operators. For example, electricity demand in the Southwest Power Pool (SPP) increased quickly in the morning hours of Monday, April 1, 2013 (see dark blue line, above). To satisfy this rapid increase in demand, system operators sent dispatch signals to numerous generators to increase their output.
While this morning ramp-up in demand occurs every day, the rate of increase in demand on April 1 was the steepest so far this year in SPP. The rate of increase in electricity demand peaked at 12.4% between 6 a.m. and 7 a.m. (see light blue line, above). The large change started with seasonal and weekend low demand overnight from Sunday and then ramped up for high business-day demand on Monday.
Meeting this increasing demand can be stressful for system and generating unit operators because system operators need to order generators to ramp up efficiently while maintaining reliability. Also, this steepest ramp occurred during the spring low-demand season when there are fewer generating units available for ramping because of unit maintenance outages.
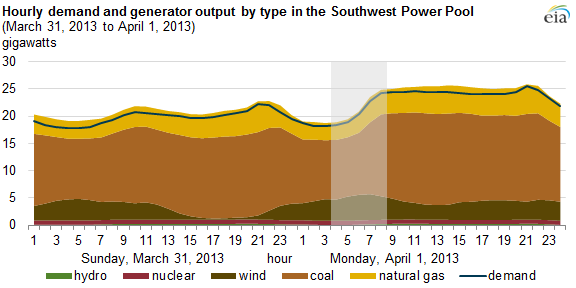
The chart above shows generator output by fuel type in SPP over the same two-day period. Coal-fired units provided the largest share of the ramping capacity. Natural gas-fired capacity provided most of the rest. On the morning of April 1, wind capacity increased for the first half of the ramping period and decreased during the last half of the period. Because wind capacity is generally not dispatched by system operators and its output depends on the winds, the pattern of wind output can change significantly during the ramp period.
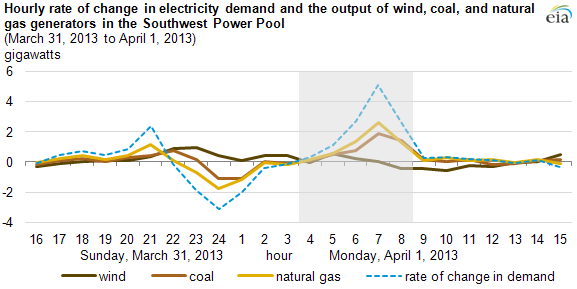
The hourly rate of change in the output of generators by fuel type (see chart above) provides further insight into how operators responded during the ramp period. This chart shows only those generator fuel types that are changing their output significantly during the ramp period: coal, natural gas, and wind. The rate of change in demand is also shown to highlight the ramp period.
While coal-fired units in this instance provided about 70% of the increase in capacity during the peak ramp hour, natural gas-fired capacity increased its output at a higher rate than coal capacity (19% to 16%). This difference is because SPP relies more on natural gas-fired capacity for quick ramping and the output of natural gas generators is starting from a smaller base than coal generators. Wind output was flat during the peak ramp hour and declined after that.
Principal contributor: William Booth
Tags: coal, consumption/demand, electricity, generation, natural gas, wind