U.S. Energy Information Administration logo
Skip to sub-navigation
May 9, 2013

Low natural gas prices in 2012 reduced returns for some oil and gas producers
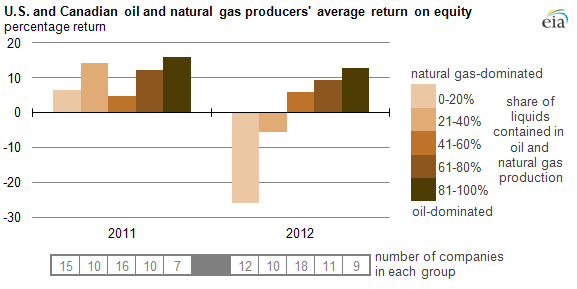
graph of US and Canada oil and gas returns on equity, as explained in the article text
Source: U.S. Energy Information Administration based on Evaluate Energy database and company financial statements.
Note: Results based on data from 60 oil and natural gas producers that had at least 80% of their production in the United States and Canada along with production levels greater than 10,000 barrels of oil equivalent per day. Sampled companies accounted for nearly half of U.S. and Canadian oil and gas production in 2012.

Low natural gas prices contributed to reduced returns on equity (ROE), a measure of profitability, for oil and natural gas producers in 2012, according to EIA analysis. Producers with lower proportions of liquids in their total oil and gas production generally had lower ROE in 2012 compared to 2011, and compared to producers with higher proportions of liquids.

Wide differences in natural gas and oil prices affected the bottom line for upstream operators and shaped their decision-making about where and how to deploy capital. In 2012, wholesale natural gas prices in the United States and Canada fell to their lowest levels in a decade. Crude oil prices, on the other hand, remained at historically high levels.

Some key findings from the analysis show that:

  • Among U.S. and Canadian oil and natural gas producers whose primary business is in North America, producers with less than 40% of their production in liquids averaged negative ROEs in 2012. Producers with liquids making up more than 40% of their production averaged positive ROEs.
  • During 2011, when natural gas spot prices at the Henry Hub averaged $4.00 per million Btu, 45% above their average level in 2012, producers in all quintiles of the distribution of liquids share of total production averaged positive ROEs.
  • The group of oil and natural gas producers with liquids accounting for more than 80% of their oil and gas production had the highest ROEs in both 2011 and 2012.

These data were calculated by EIA using the Evaluate Energy database.

Statistics
Analysis
Tools
Education
News

Petroleum & Other Liquids

Crude oil, gasoline, heating oil, diesel, propane, and other liquids including biofuels and natural gas liquids.

Natural Gas

Exploration and reserves, storage, imports and exports, production, prices, sales.

Electricity

Sales, revenue and prices, power plants, fuel use, stocks, generation, trade, demand & emissions.

Coal

Reserves, production, prices, employment and productivity, distribution, stocks, imports and exports.

Nuclear & Uranium

Uranium fuel, nuclear reactors, generation, spent fuel.

Renewable & Alternative Fuels

Includes hydropower, solar, wind, geothermal, biomass and ethanol.

EIA Survey Forms

Forms EIA uses to collect energy data including descriptions, links to survey instructions, and additional information.

Total Energy

Comprehensive data summaries, comparisons, analysis, and projections integrated across all energy sources.

U.S. States

State energy information, including overviews, rankings, data, and analyses.

International

International energy information, including overviews, rankings, data, and analyses.

Environment

Greenhouse gas data, voluntary reporting, electric power plant emissions.

Data Tools, Apps, & Maps

Tools to customize searches, view specific data sets, study detailed documentation, and access time-series data.

Open Data

EIA's free and open data available as API, Excel add-in, bulk files, and widgets

EIA Beta

Come test out some of the products still in development and let us know what you think!

Open Source Code

EIA's open source code, available on GitHub.

RSS Feeds

Subscribe to feeds for updates on EIA products including Today in Energy and What's New.