
Transportation fuel use is a key factor in the outlook for U.S. oil imports
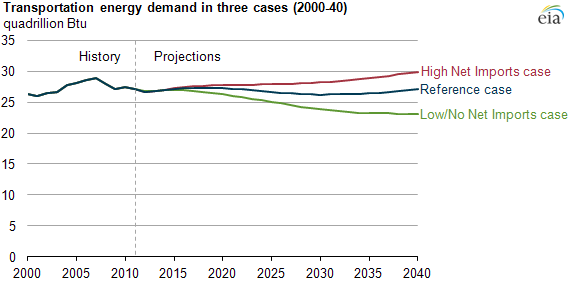
The level of U.S. reliance on net imports of liquid fuels diverges from the Reference case under different domestic supply and demand conditions, particularly demand from the transportation sector. In the Annual Energy Outlook 2013 (AEO2013) Low/No Net imports case, transportation sector demand for liquid fuels in 2040 is 15%, or 4 quadrillion Btu, below the Reference case level.
The reduced demand for energy in the Low/No Net Imports case is driven by significant reductions in light-duty vehicle travel that reflect both changes in consumer preferences and a general shift in mobility needs (for example, population shifts to a more urban setting where other transportation options are available). This analysis also assumes increased stringency in fuel economy requirements, coupled with a more rapid development of transportation technology that reduces cost and improves efficiency. This case also includes an expansion of alternative fuel markets across all transportation modes, including light-duty vehicles such as passenger cars, heavy-duty vehicles such as freight-hauling trucks, and rail, marine, and air transportation.
In contrast, the assumption of directionally opposite changes in demand conditions leads to an 11% higher overall transportation energy demand in the High Net Imports case compared with the Reference case, reaching almost 30 quadrillion Btu by 2040. Higher energy demand in this case reflects the effects of pessimistic assumptions regarding several factors: the development of new vehicle technologies and consumer acceptance of these technologies, rate of efficiency improvement in nonhighway modes, and market acceptance of alternative fuels. In this case, future fuel economy standards are not met, and consumption of alternative fuels is lower than that projected in the Reference case.
Further detail on EIA's analysis of U.S. liquids fuels dependence can be found in the full Annual Energy Outlook 2013.