
The South China Sea is an important world energy trade route
Note: Click map to enlarge.
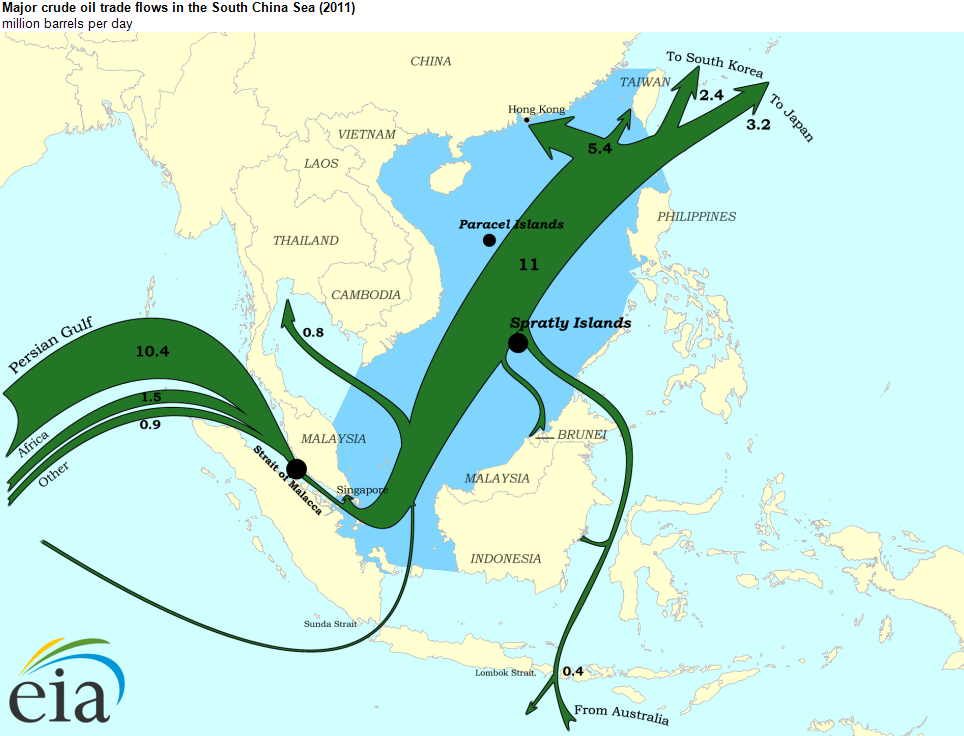
Stretching from Singapore and the Strait of Malacca chokepoint in the southwest to the Strait of Taiwan in the northeast, the South China Sea is one of the most important energy trade routes in the world. Almost a third of global crude oil and over half of global liquefied natural gas (LNG) passes through the South China Sea each year.
The Strait of Malacca is the shortest sea route between African and Persian Gulf suppliers and Asian consumers. The strait is a critical transit chokepoint and has become increasingly important over the last two decades. In 1993, about 7 million barrels per day (bbl/d) of oil and petroleum products (20% of world seaborne oil trade) passed through the Strait of Malacca, according to the Center for Naval Analysis. EIA estimates that by the end of 2011, trade through Malacca was greater than 15 million bbl/d, or about one-third of all seaborne oil. In comparison, the world's most important chokepoint for maritime transit, the Strait of Hormuz between the Persian Gulf and Arabian Sea, had an oil flow of about 17 million bbl/d in 2011 (see World Oil Transit Chokepoints). Average daily oil consumption worldwide in 2011 was about 88.3 million bbl/d.
A significant amount of crude oil arriving in the Strait of Malacca (1.4 million bbl/d) goes to terminals in Singapore and Malaysia instead of continuing on to the South China Sea. After processing, this crude oil is shipped out again to Asian markets through the South China Sea as refined petroleum products, such as motor gasoline and jet fuel. The rest of the crude oil passes through the South China Sea to China and Japan, the two largest energy consumers in Asia. Finally, about 15% of crude oil moving through the South China Sea goes on to the East China Sea, mostly to South Korea.
Crude oil flow in the South China Sea also comes from intraregional trade, particularly from Malaysian, Indonesian, and Australian crude oil exports. Intraregional trade is distributed evenly among Singapore, South Korea, Japan, and China, with smaller amounts going to other Southeast Asia countries.
Note: Click map to enlarge.
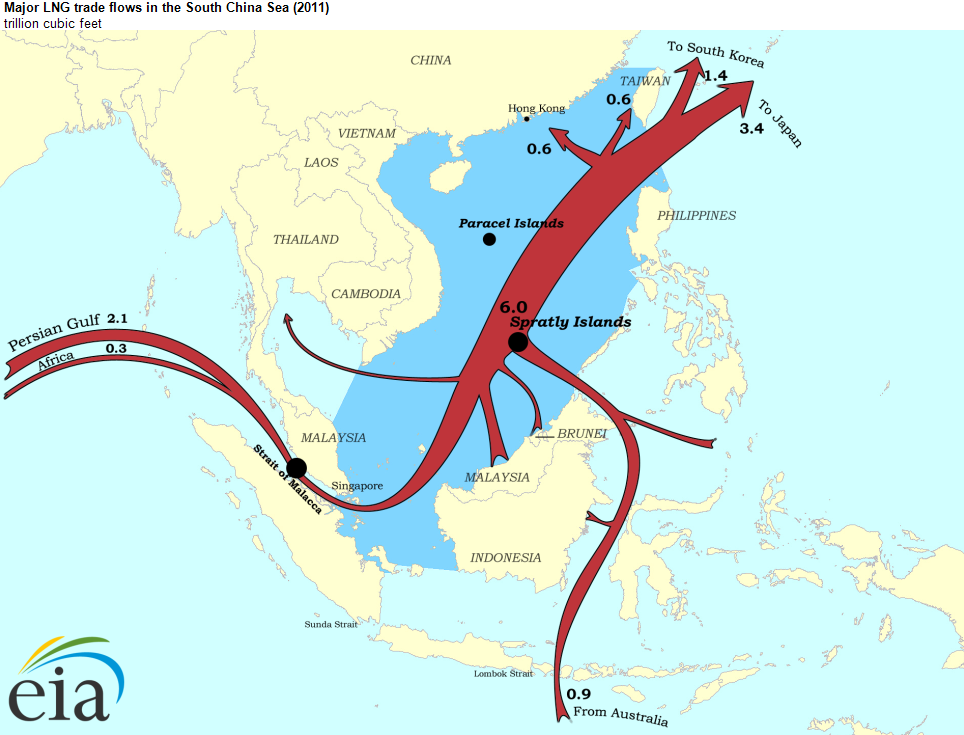
The South China Sea is also a major destination for LNG exports. About 6 trillion cubic feet (Tcf) of liquefied natural gas, or more than half of global LNG trade, passed through the South China Sea in 2011. Half of this amount continued on to Japan, with the rest of it going to South Korea, China, Taiwan, and other regional countries. Almost 75% of all LNG exports to the region came from Qatar, Malaysia, Indonesia, and Australia.
With growing demand for natural gas in East Asia, the South China Sea's share of global LNG trade will likely increase in the coming years. Moreover, Japan has increased its LNG imports to replace the energy lost from nuclear power outages following the Fukushima crisis. Much of the new supply will come through the Strait of Malacca, although some countries like Indonesia are investing in their own LNG export capacity.
Finally, large quantities of coal from Australia and Indonesia, the world's two largest coal exporters, pass through the South China Sea to markets around the world, especially to China, Japan, and India. These coal shipments include both steam coal used for generating electricity and process heat as well as metallurgical coal that is a key ingredient in primary steel production.
For more information, see the South China Sea Regional Analysis Brief.