
Natural gas vehicle fuel prices rose in 2022 and 2023 after a decade of relative stability
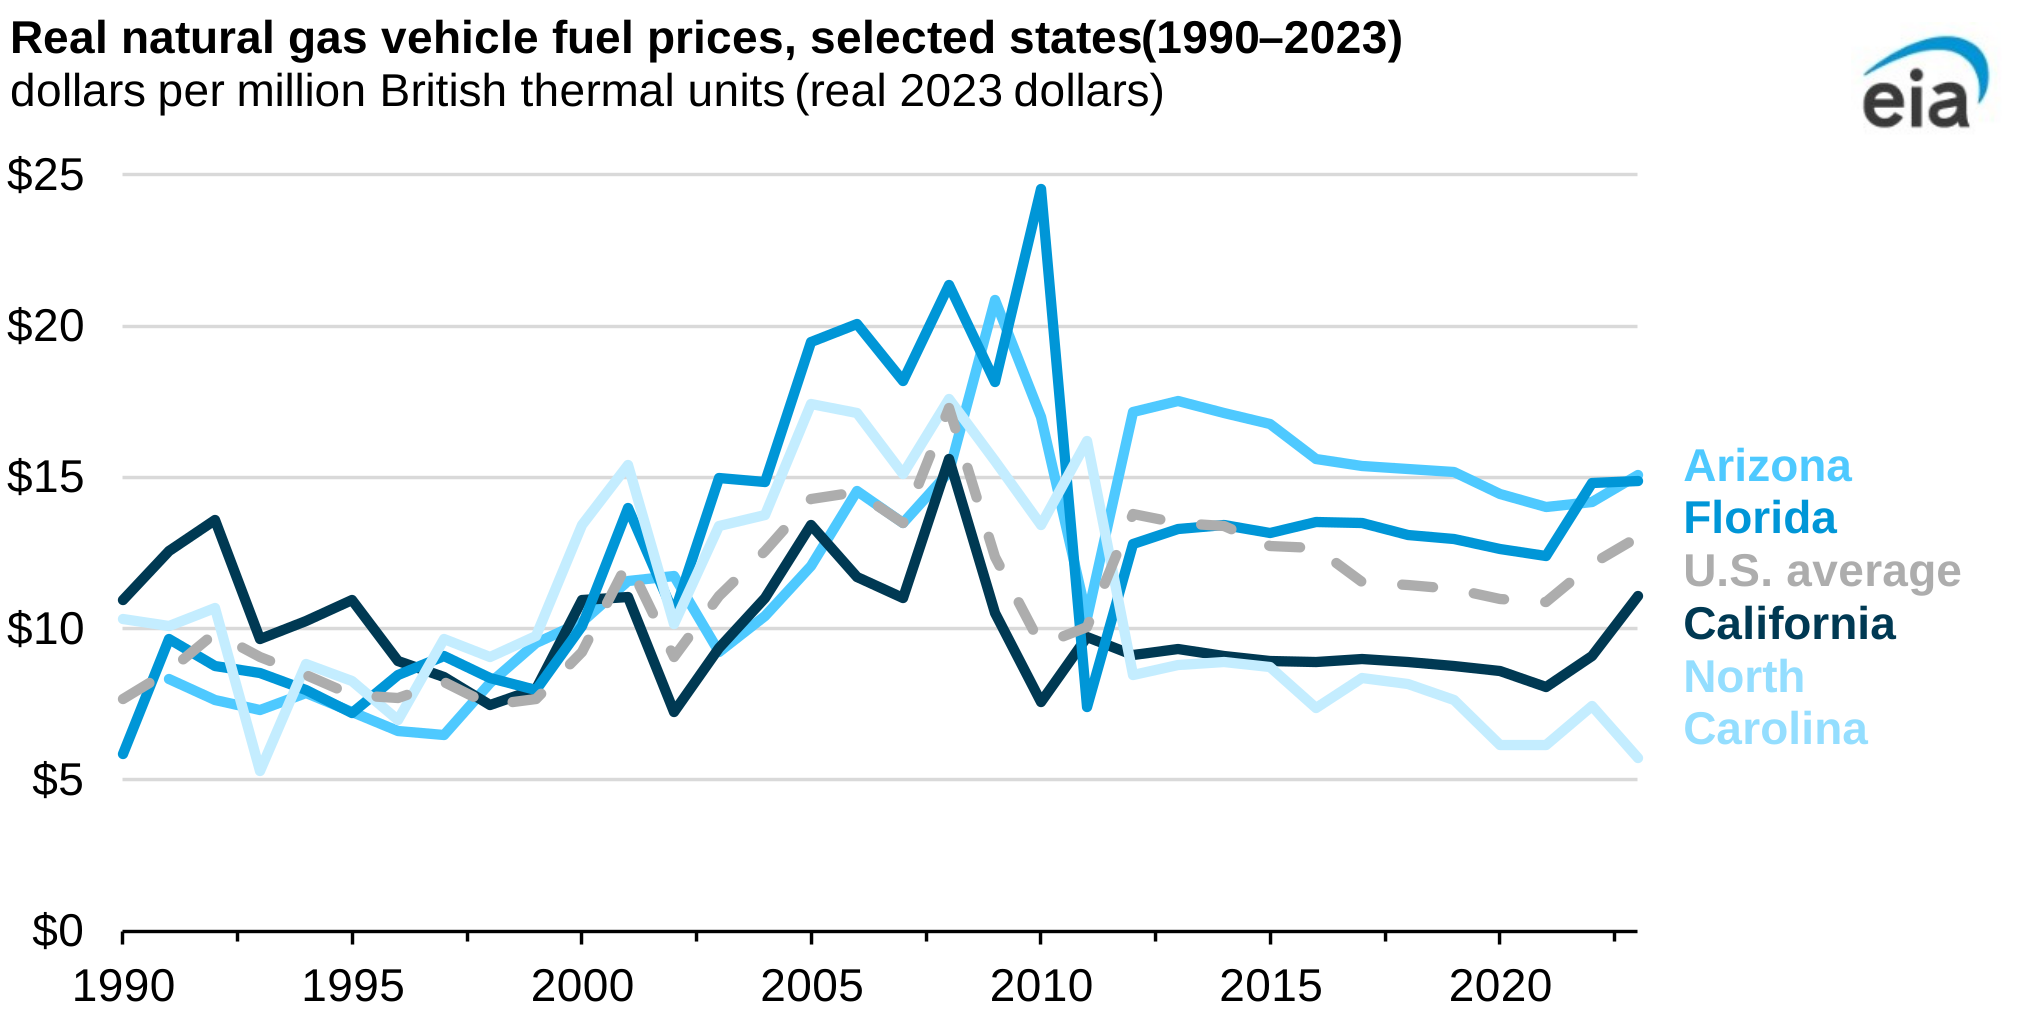
Note: Real prices are adjusted for inflation with the Consumer Price Index from the U.S. Bureau of Labor Statistics.
After a decade of nearly flat prices from 2011 to 2021, inflation-adjusted fuel prices for natural gas vehicles increased in 37 states from 2021 to 2023, according to new estimates in our State Energy Data System (SEDS). Real U.S. natural gas prices for vehicle fuel remained 25% below their peak in 2008.
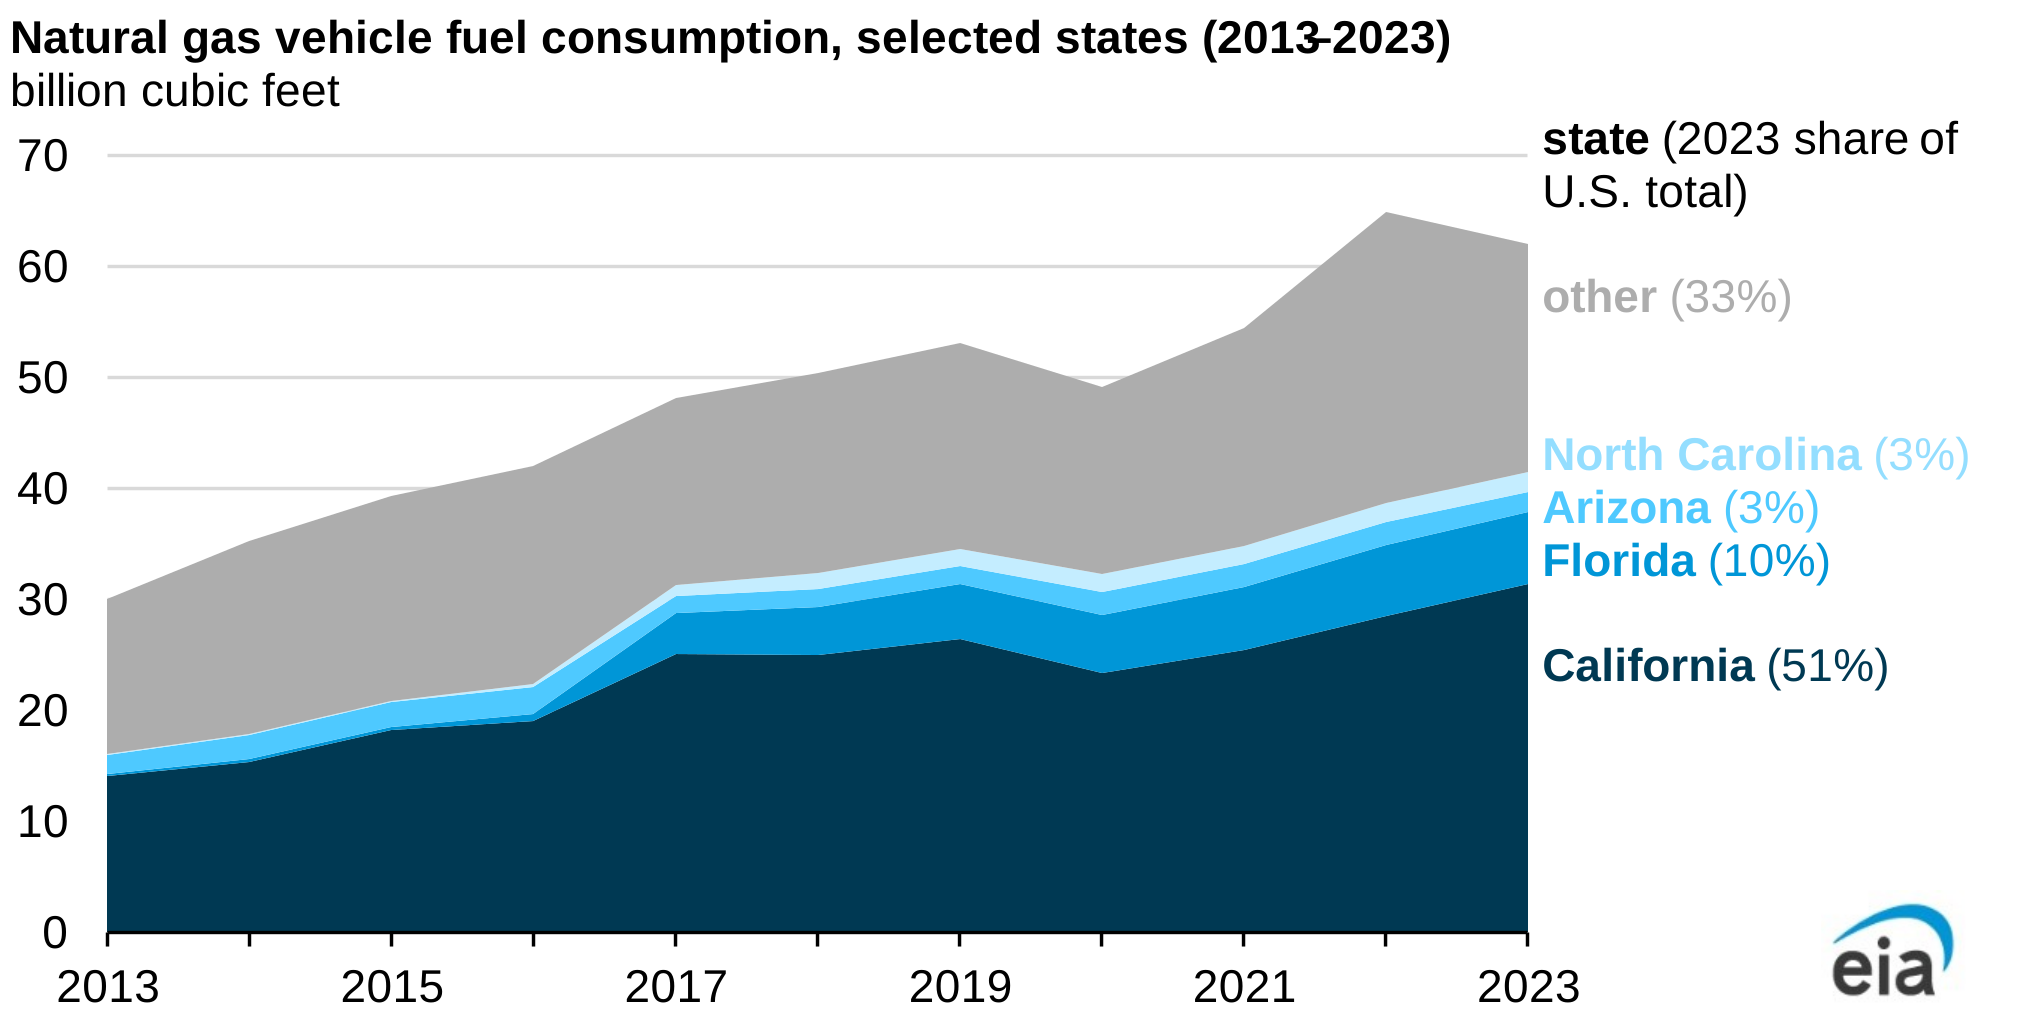
Natural gas sold to the on-road vehicle fuel market in the United States more than doubled over the past decade from 30 billion cubic feet (Bcf) in 2013 to more than 62 Bcf in 2023. Many U.S. natural gas-powered vehicles are government agency-owned fleet cars and buses. Most of these vehicles consume compressed natural gas (CNG) for light-, medium-, and heavy-duty vehicles, with some smaller amounts of liquefied natural gas (LNG) for larger trucks. The two main advantages of a natural gas-powered vehicle compared with a motor gasoline- or diesel-powered vehicle are that natural gas emits less CO2 emissions than petroleum when combusted and that natural gas prices are typically lower than petroleum products such as motor gasoline.
In 2023, natural gas vehicle fuel prices ranged from a high of $34.66 per million British thermal units (MMBtu) in Rhode Island to a low of $5.73/MMBtu in North Carolina. Many factors affect natural gas prices, including weather, supply, demand, international trade, and storage. See our extended analysis on natural gas prices in our Short-Term Energy Outlook.
More natural gas is consumed in California for vehicle fuel than in any other state in every year on record since 1997, in part because of its many laws and incentives for CNG and LNG. In 2023, California accounted for 51% of the nation’s market for natural gas vehicle fuel. Florida, the state with the next-largest consumption, accounted for 10%, and no other state accounted for more than 3% in 2023. Consumption of natural gas vehicle fuel has increased in North Carolina, which has several state laws and incentives for CNG, at a faster rate than in any other state, growing from 71 million cubic feet in 2013 to nearly 1.8 Bcf in 2023. Our analysis estimates that natural gas powers about 156,000 vehicles in the United States, or less than 1% of the 296 million registered vehicles in 2023.
Since 2013, we have not published natural gas vehicle fuel prices in our Natural Gas Annual. Instead, we estimate annual state-level prices using a model in our SEDS. We recently improved our model using data from the U.S. Department of Energy’s Alternative Fuels Data Center’s quarterly Clean Cities Alternative Fuel Price Report survey, and we revised our previous estimates for 2013–22.
Principal contributors: Mickey Francis, Melissa Alejandro