
Horizontal drilling boosts Pennsylvania’s natural gas production
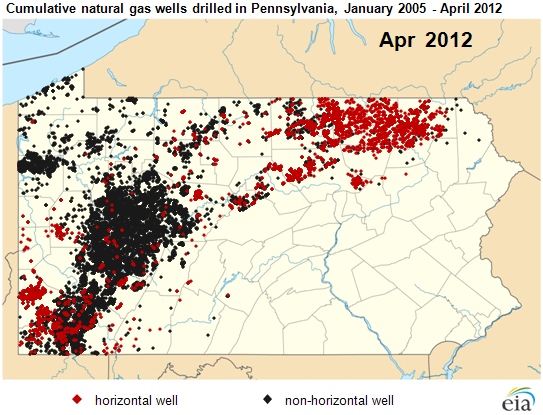
Between 2009 and 2011, Pennsylvania's natural gas production more than quadrupled due to expanded horizontal drilling combined with hydraulic fracturing. This drilling activity, which is concentrated in shale formations that cover a broad swath of the state, mirrors trends seen in the Barnett shale formation in Texas.
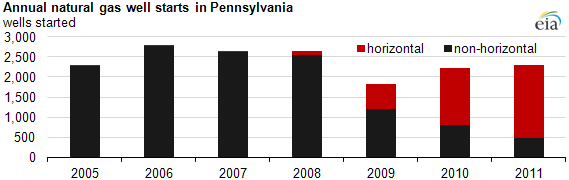
The animation illustrates Pennsylvania's relatively recent transition from conventional vertical wells (black diamonds) to horizontal wells (red diamonds), drilled mostly in sections of the Marcellus, Utica, and Geneseo/Burket shale formations located in the northeast and southwest portions of the state. The animation also shows that as horizontal drilling increased, the number of vertical wells—which are typically less productive—fell, resulting in an overall decline in the state's new well count.
Historically, natural gas exploration and development activity in Pennsylvania was relatively steady, with operators drilling a few thousand conventional (vertical) wells annually. Prior to 2009, these wells produced about 400 to 500 million cubic feet per day of natural gas. With the shift to and increase in horizontal wells, however, Pennsylvania's natural gas production more than quadrupled since 2009, averaging nearly 3.5 billion cubic feet per day in 2011. Natural gas wells accounted for virtually all (99%) of the horizontal wells started over this period.
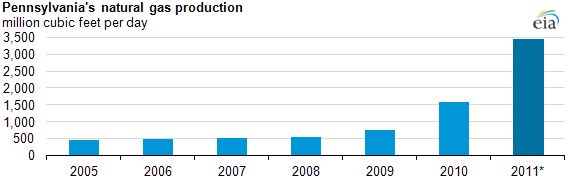
Note: *EIA production data are used for 2005-2010 due to reporting issues with 2010 data provided by the Pennsylvania Department of Environmental Protection (DEP). DEP data are used for 2011 as EIA data are not yet available; EIA volumes are expected to be similar.
Drilling programs in Pennsylvania's shale formations, like those in other, more established plays such as the Barnett and Eagle Ford in Texas, are migrating to more liquids-rich areas due to the price premium of crude oil and natural gas liquids. The effect of low natural gas prices is apparent in Pennsylvania's 2012 well count for the first third of the year. From January through April, drilling began on 618 new natural gas wells; over 700 new natural gas wells were started over the same period in 2011. In contrast, 263 new oil and "combination" (oil and natural gas) wells were started in Pennsylvania from January through April 2012, well above the 164 new wells that began drilling during the corresponding period in 2011.
Tags: drilling, Marcellus, natural gas, Pennsylvania, production/supply, shale