
Over the past decade, lighting became more efficient across all sectors
Download CSV Data
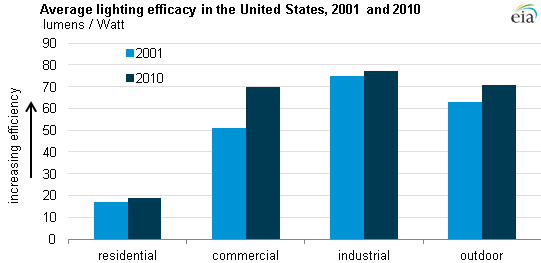
The Department of Energy (DOE) recently released a study of the 2010 lighting market, finding that lighting across all sectors became more energy efficient since their study of the 2001 lighting market. The residential sector, which accounted for 25% of total lighting energy consumption in 2010, remained the least energy efficient of the sectors, primarily due to the use of incandescent lamps. Lighting efficiency is often expressed as efficacy, or the ratio of light output (measured in lumens) to the electric power input (measured in Watts).
Since the DOE's previous market characterization in 2001, the commercial sector made the most improvement in efficiency. Rather than switching between lighting types, the commercial sector switched out larger-diameter T12 linear fluorescent lamps and replaced them with smaller-diameter T8 and T5 lamps. In 2010, DOE estimated that the commercial sector accounted for half of all lighting energy consumption. The residential sector was estimated at 25%; industrial, 8%; and outdoor, 17%.
Residential lighting is expected to become more efficient as new standards mandated by law go into effect. While the new standards do not specifically prohibit any bulb type, they do limit wattages for certain lumen ranges, and conventional incandescent bulbs exceed these minimum wattage levels. As the chart below shows, in 2010 the residential sector used incandescent technology to provide about half of its light output.
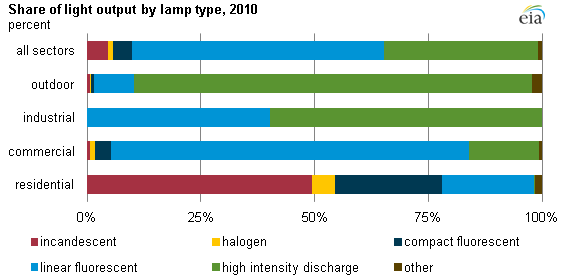
Note: Shares are defined by the portion of light output (in lumen-hours) provided by each lamp type. "Other" includes light-emitting diode (LED) lamps as well as other lamps such as fiber optic lights, induction lamps, and lamps of unknown characteristics
Download CSV Data
Determining a building's lighting energy consumption level requires detail on both the lighting type and hours of usage for each lamp. DOE's study shows the average residential building has over 50 lamps, and the average commercial or industrial building each has about 300 lamps.
EIA's consumption surveys contain estimates of lighting characteristics and consumption estimates within the residential and commercial buildings sectors. However, these surveys do not capture the level of detail needed to fully characterize the lighting market, especially for industrial and outdoor lighting (roadways, parking, billboards, traffic signals, etc.). Rather than considering building surveys alone, DOE's market characterization relies on building lighting audits, industry surveys, national lamp shipment data, and interviews with lighting professionals and subject matter experts to arrive at its estimates for the national and sector-specific levels.