
More OPEC production and higher global natural gas prices widen crude oil price spreads
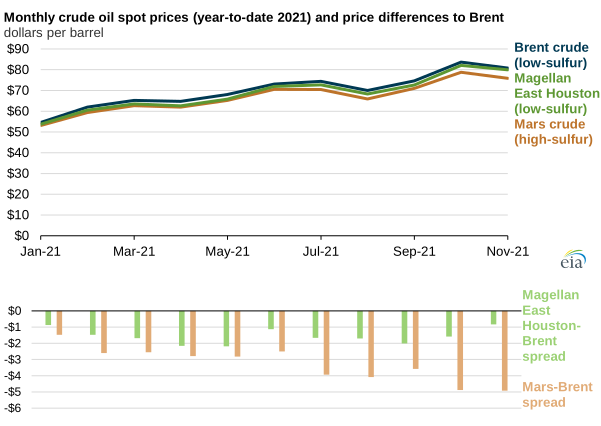
Recently, prices of high-sulfur crude oils have been declining relative to low-sulfur crude oils. Rising crude oil exports from OPEC members that produce higher-sulfur crude oils, also called sour crude oils, and higher natural gas prices have contributed to lower prices for sour crude oils relative to low-sulfur (sweet) crude oils.
Sour crude oils typically sell at a discount to sweet crude oils because they must first be treated with hydrogen to meet low-sulfur fuel specifications. They also require desulfurization to avoid damage to refinery units.
In recent months, however, sour crude oil discounts have increased compared with historical averages. For example, Mars crude oil, which is a relatively sour crude oil produced in the Federal Offshore Gulf of Mexico, has decreased in price relative to the sweet Magellan East Houston and Brent crude oils. Brent crude oil is produced in the North Sea of the United Kingdom.
The Mars crude oil spot price averaged $4.92 per barrel (b) less than the Brent crude oil spot price in November. This price spread is higher than the $4.09/b average price difference between Mars and Brent crude oil in August (the first month of recently announced production increases from OPEC+). The spread is also significantly higher than the $1.47/b average spot price difference between Mars and Brent crude oil in January.
The increasing price of sweet Magellan East Houston crude oil relative to the price of Brent crude oil suggests geography is not the cause of the increasing Mars crude oil price discount to Brent crude oil. Magellan East Houston and Brent are both light, sweet crude oils of similar quality, and therefore, the Magellan East Houston-Brent spread reflects how geographic and logistical factors affect U.S. Gulf Coast crude oil prices relative to Brent prices. Differences in supply and demand for sweet versus sour crude oils likely explain the increasing discount between Mars crude oil and Brent crude oil.
One contributing factor to the widening spread between sweet and sour crude oils is the increasing supply of medium and heavy sour crude oils. OPEC has been increasing its production and exports since the second half of 2021, particularly in countries that produce sour grades. Unlike the sour crude oil supply that has been increasing, supply from OPEC members that produce mostly sweet crude oils has been relatively flat. Likewise, U.S. production in the Lower 48 states (primarily sweet crude oil) has also been relatively flat.
A second contributing factor to the widening spread between sweet and sour crude oils is higher natural gas prices. The hydrogen used to treat sour crude oils is often produced using steam methane reforming, a process that uses natural gas as an input. As a result, the recent increases in global natural gas prices have contributed to higher refinery feedstock costs. Higher costs have led to lower demand for sour crude oils that incur more of these costs, at the same time increasing demand for sweeter crude oils that avoid these extra costs.
Principal contributor: Jimmy Troderman