
U.S. fuel ethanol production capacity increased by 3% in 2019
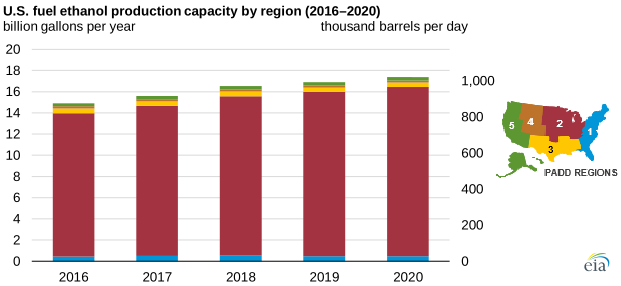
Note: PADD=Petroleum Administration for Defense District.
Fuel ethanol production capacity in the United States totaled 17.3 billion gallons per year (gal/y), or 1.1 million barrels per day (b/d), as of January 2020, according to the U.S. Energy Information Administration’s (EIA) 2020 U.S. Fuel Ethanol Plant Production Capacity Report, released on September 25, 2020. Nameplate capacity of operable ethanol plants increased by 3%—470 million gal/y—between January 2019 and January 2020.
The annual U.S. Fuel Ethanol Plant Production Capacity Report shows EIA’s most up-to-date data of U.S. fuel ethanol industry capacity by plant. EIA uses industry trade journals to track fuel ethanol market conditions. To ensure the quality of its data, EIA staff contacts plants that report production capacities to EIA that are inconsistent with those published in other sources.
Most U.S. fuel ethanol production capacity is located in the Midwest region (Petroleum Administration for Defense District, or PADD, 2). Total nameplate capacity in the Midwest totaled 15.9 billion gal/y (1.0 million b/d) at the beginning of 2020, an increase of 3% between January 2019 and January 2020.
Of the top 13 fuel ethanol-producing states, 12 are located in the Midwest. The three states with the most ethanol production capacity—Iowa, Nebraska, and Illinois—contain half of the nation’s total.
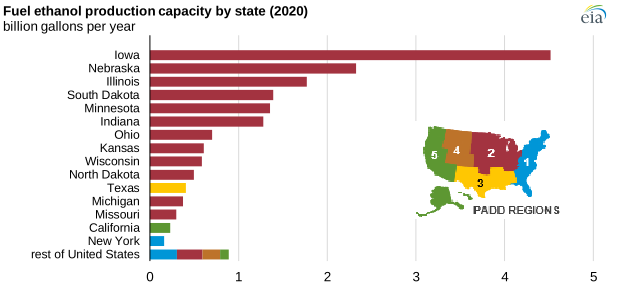
Note: PADD=Petroleum Administration for Defense District.
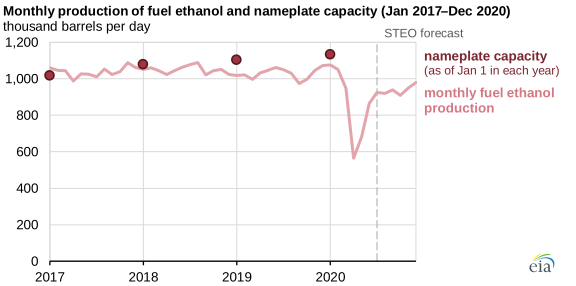
U.S. production of fuel ethanol reached 15.8 billion gallons (1.03 million b/d) in 2019, the fourth consecutive year that production of fuel ethanol was more than 1 million b/d. Although fuel ethanol production capacity increased year over year as of January 2020, fuel ethanol production has declined more recently. U.S. fuel ethanol production fell significantly in late March and in April 2020, driven by significant reductions in motor gasoline demand as a result of responses to the 2019 novel coronavirus disease (COVID-19). Because almost all finished motor gasoline sold in the United States is blended with 10% ethanol (E10), the drop in gasoline demand has driven similar decreases in fuel ethanol demand and, correspondingly, fuel ethanol production.
In the September 2020 Short-Term Energy Outlook (STEO), EIA expects U.S. production of fuel ethanol to average 0.90 million b/d in 2020, which is 13% lower than 2019 levels. Fuel ethanol production reached a low of 0.56 million b/d in April 2020 when demand dropped because of COVID-19 mitigation efforts. EIA forecasts that fuel ethanol production will average 0.98 million b/d in December 2020.
To meet the increased demand for hand sanitizers as a result of COVID-19 concerns, some fuel ethanol and beverage ethanol plants are now producing industrial alcohol. The ethanol data reported to EIA on Form EIA-819, Monthly Oxygenates Report, are for fuel ethanol and only include barrels intended for motor fuel applications, such as blending to produce gasoline. Any ethanol intended for non-fuel use, such as to produce hand sanitizers, is not reported to EIA.
Principal contributor: Chris Buckner
Tags: production/supply, liquid fuels, ethanol