
In 2018, U.S. energy expenditures increased for the second consecutive year
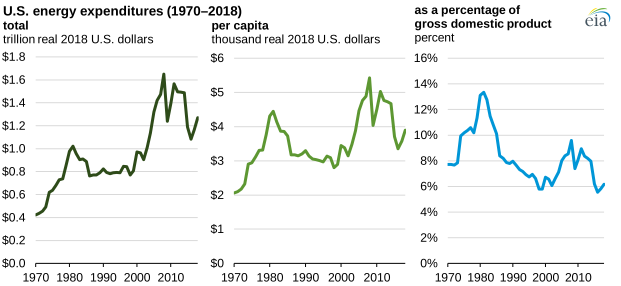
U.S. total energy expenditures, the total amount of money spent directly by consumers to purchase energy, increased for the second year in a row to $1.3 trillion in 2018, according to the latest data in the U.S. Energy Information Administration’s (EIA) State Energy Data System (SEDS). U.S. energy expenditures increased by nearly $200 billion from 2016 to 2018, a 17% increase in real terms, as both energy consumption and average energy prices increased faster than population and gross domestic product (GDP) in the United States.
EIA calculates energy expenditures by source and sector as the product of end-use energy consumption and average energy prices paid by end users. EIA also calculates energy expenditures per capita (per person) and energy expenditures expressed as a percentage of GDP.
U.S. energy expenditures per capita, which include the amount of money spent on all energy used in businesses, offices, homes, industrial facilities, and vehicles, increased from the 2016 low of $3,215 per person (the lowest value since 2002) to $3,891 per person by 2018, a 16% increase.
In the same period, the share of U.S. energy expenditures per GDP, which compares the amount of money spent on energy versus the value of all goods and services in the entire U.S. economy, increased by 11%. Total energy expenditures increased in every U.S. state, along with energy expenditures per capita and energy expenditures as a percentage of GDP, from 2016 to 2018.
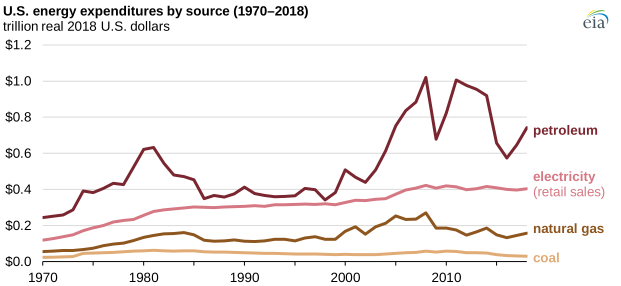
Petroleum products, such as motor gasoline, diesel, jet fuel, and hydrocarbon gas liquids, account for the largest share of energy expenditures in the United States. In 2018, U.S. petroleum expenditures totaled $742 billion, about 58% of total energy expenditures. Texas, the state with the most petroleum expenditures every year since 1979, accounted for $108 billion in 2018, almost 15% of the nation’s total petroleum expenditures.
In 2018, electricity retail sales, which include all natural gas, coal, nuclear, renewables, and petroleum used to generate electricity in the electric power sector, were the second-largest source of U.S. energy expenditures, at $403 billion, or 32% of the total. EIA’s electricity retail sales expenditures estimate the amount of money spent by end-use customers, including businesses and homes that pay for electricity as it is consumed. EIA removes the expenditures of primary energy sources (natural gas, coal, nuclear, renewables, and petroleum) used by the electric power sector to generate electricity to avoid double counting expenditures.
Natural gas used for purposes other than in the electric power sector (for example, as heat for homes and businesses or in industrial processes) accounted for $158 billion (12% of the total) in 2018. California, the state with both the most electricity and natural gas expenditures, accounted for 10% and 9% of the nation’s total expenditures of each source, respectively, in 2018.
Most coal in the United States is used in the electric power sector to generate electricity. Coal used for purposes other than in the electric power sector (for example, as heat in metallurgical manufacturing processes) accounted for 2% of U.S. energy expenditures.
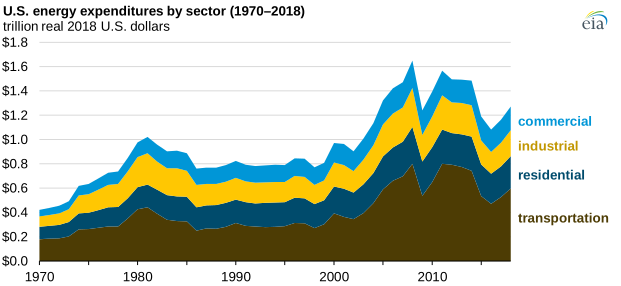
The transportation sector accounted for the largest share of U.S. energy expenditures at $598 billion, or 47% of total U.S. sector energy expenditures in 2018. The residential sector has been the second-largest sector for energy expenditures since 2012, when it surpassed the industrial sector. The residential and industrial sectors totaled $267 billion (21% of U.S. total) and $213 billion (17%), respectively, in 2018. The commercial sector had the smallest share of energy expenditures in the United States at $193 billion (15%) in 2018.
Principal contributor: Mickey Francis