
Net petroleum product exports continue to increase
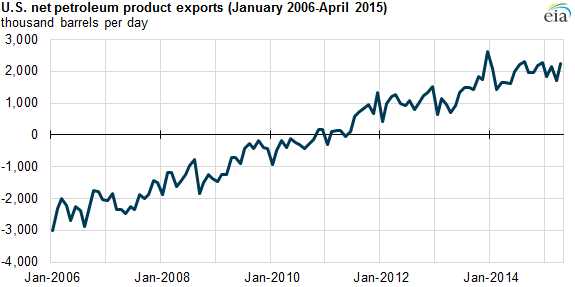
Over the past decade, domestic refinery output of petroleum products has grown significantly while consumption has declined, resulting in a major increase in product exports. Petroleum product exports averaged 4.1 million barrels per day (b/d) in the first four months of the year, an increase of 0.5 million b/d over exports the same time last year. Product imports are also higher than last year, but to a lesser extent, leading to an increase in net petroleum product exports.
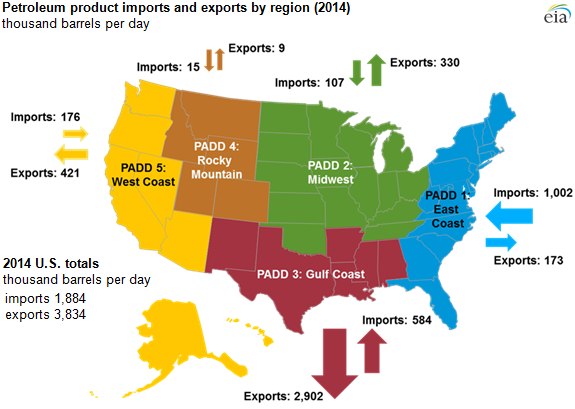
Import and export patterns vary by region, with most exports leaving from the Gulf Coast (Petroleum Administration for Defense District 3), and imports coming to the East Coast (PADD 1). Record-high refinery runs and increased global demand for petroleum products from the United States continue to push exports higher.
Note: Totals may not add because of independent rounding.
More than half of the country's refinery capacity is located in PADD 3, and roughly 75% of U.S. product exports are sent from that region. Through April, Gulf Coast petroleum product exports were up 444,000 b/d compared with the same time last year. Gasoline, distillate, and jet fuel exports combined accounted for 40% of the increase. Higher levels of gasoline and distillate exports were sent to countries in the Western Hemisphere, while gasoline exports to Africa decreased slightly. Jet fuel exports have primarily increased to Western Europe, Central America (plus Mexico), and South America, and to a lesser extent Africa. Propane and naphtha exports are each more than 150,000 b/d higher than last year, and are primarily sent to Asia.
Product imports remain an important source of supply on the East Coast, supplementing in-region refinery production and receipts from the Gulf Coast and, to a lesser extent, from the Midwest (PADD 2). U.S. motor gasoline product supplied has been 71,000 b/d higher so far in 2015 compared with last year, and imports of total motor gasoline (including both blending components and finished gasoline) have increased by 103,000 b/d.
Petroleum product markets on the West Coast are typically tightly balanced, with in-region refinery production nearly evenly matched with demand. The West Coast is largely isolated from the rest of the country's petroleum markets because there are no pipelines that cross the Rocky Mountains. However, in recent years, the region's supply of distillate fuel has exceeded demand and, as a result, exports have increased. West Coast distillate exports averaged 117,000 b/d so far this year, in line with the previous two years and 37,000 b/d higher than in 2012. During times of supply disruptions, imports to the West Coast often increase to replace lost supply from in-region refineries, as has been the case so far in 2015. Following an outage caused by an explosion and fire at ExxonMobil's Torrance, California, refinery in mid-February, gasoline imports to the West Coast increased, and they have averaged 37,000 b/d so far this year, more than double compared with the same time last year.
The future of net exports will depend on underlying trends in both output and consumption of petroleum products. Future output will reflect both U.S. refinery runs and the production of hydrocarbon gas liquids outside of refineries. Future domestic consumption will reflect prices, economic activity, and policies such as fuel economy standards for both light- and heavy-duty vehicles. So long as domestic output of petroleum products grows faster than their consumption, net petroleum product exports will continue to rise.
Principal contributor: Hannah Breul