
U.S. energy-related carbon dioxide emissions increase in past two years
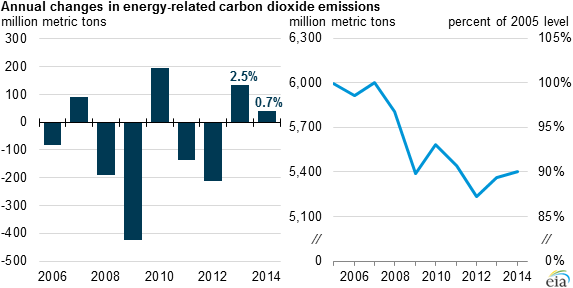
For the second year in a row, energy-related carbon dioxide (CO2) emissions in the United States have increased. However, unlike 2013, when emissions and gross domestic product (GDP) grew at similar rates (2.5% and 2.2%, respectively), 2014's CO2 emissions growth rate of 0.7% was much smaller than the 2014 GDP growth rate of 2.4%.
Energy-related CO2 emissions are the largest component of overall U.S. greenhouse gas emissions. On March 31, 2015, the United States officially submitted its emissions-cutting target to the United Nations, committing to reducing U.S. greenhouse gas emissions 26%-28% from 2005 levels by 2025. This follows President Obama's 2009 pledge to reduce U.S. greenhouse gas emissions to 17% below 2005 levels by 2020.
As discussed in a previous article, changes in CO2 emissions reflect changes in economic and energy-related indicators. The previous two years have largely followed the economic trends in terms of increasing population and per capita GDP, but have broken the trends of declining energy and carbon intensities:
- Population grew at an average annual rate of 0.7% during 2005-14, and the U.S. economy, as measured by GDP, grew by 1.4% per year since 2005. Growth rates for population and GDP in the previous two years (2012 and 2013) were generally consistent with those trends.
- The amount of energy consumption per unit of GDP, or the energy intensity of the U.S. economy, has generally improved in the past decade, as less energy was needed to produce economic growth. In 2014, the United States required 13% less energy than in 2005 per unit of GDP. In 2013 there was a slight increase in energy intensity of 0.7%, largely because of weather-related energy consumption, but energy intensity fell in 2014 by 1.2%.
- Carbon intensity, or the amount of CO2 emissions per unit of energy consumption, declined in total by 8% during 2005-14, with an average annual decline of 0.9%. In 2013 and 2014, however, carbon intensity declined by only 0.4%.
Estimated emissions of 5,404 million metric tons of CO2 from energy-related sources occurred in 2014, and energy-related CO2 emissions are projected to increase slightly in both 2015 and 2016. In the Reference case in EIA's recently released Annual Energy Outlook 2015, emissions are expected to increase only slightly, at a rate of 0.1% annually, and to remain below 2005 levels by more than 400 million metric tons in 2040. Future energy consumption and related emission levels will depend largely on a mix of weather, energy sources, and economic factors—as well as potential changes in national and state policies.
Principal contributor: Perry Lindstrom
Tags: CO2 (carbon dioxide), emissions