
Changes in natural gas spot prices may not quickly translate to consumer prices
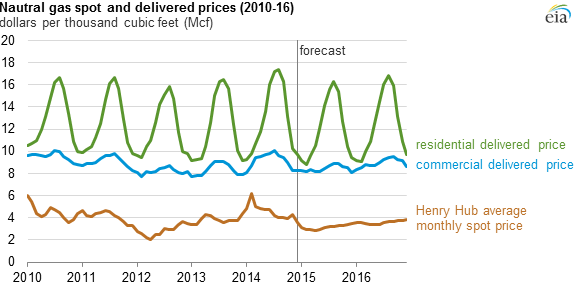
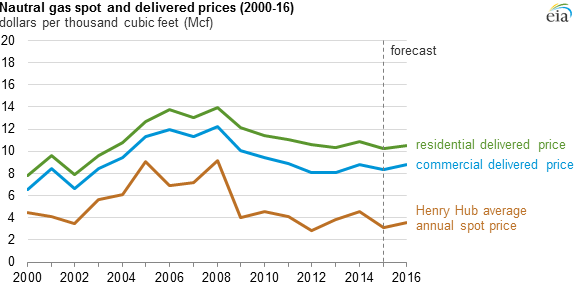
While natural gas wholesale spot prices have dropped to relatively low levels since the end of 2014, these low prices have not translated directly into lower retail prices for consumers who use natural gas to heat their homes and businesses. This short-term lag is largely due to the nature of utility regulation. Over longer periods, changes in natural gas spot and residential prices are much more closely correlated.
Local distribution companies (LDCs, or the utility companies that serve residential and commercial consumers) have several different ways to ensure adequate supplies of natural gas for the winter. Several of these approaches occur months before the heating season begins. For example, as a physical hedge, many LDCs begin buying and storing natural gas for the upcoming winter as early as April. LDCs can also purchase gas ahead of time for later delivery by using New York Mercantile Exchange (Nymex) futures contracts. These contracts lock in a certain price for the utility and help shield the company from fluctuations in the spot market.
To supplement their hedging, LDCs may buy additional natural gas as needed on the spot market during the winter heating season. These hedging approaches mean that residential and commercial prices often reflect the cost of gas purchased many months ago. Additionally, residential and commercial prices are regulated by the state regulator, and rate changes may significantly (by a year or more) lag changes in the LDC's costs of purchasing natural gas.
Because natural gas is the primary heating fuel for about half of all U.S. households, consumers use more natural gas in the winter. Somewhat counterintuitively, residential and commercial prices are higher on a per-unit basis during the summer. However, the variations in seasonal consumption often outweigh these differences in prices, so monthly expenditures are more likely to reflect large changes in consumption rather than relatively small seasonal differences in per-unit prices.
In addition to taxes and other fees, the per-unit price the customer pays represents two major components: a fixed component, to cover the LDC's operating costs and costs of transporting natural gas to the consumer, and a variable component, representing the cost of natural gas. On a per-unit basis, the price of natural gas is much higher in the summer because the fixed costs are spread out over a smaller volume, so residential prices are usually highest in the summer and lowest in the winter. However, the increase in consumption during the winter is often greater than the related decline in the average price such that average household expenditures on natural gas are higher during the winter. Commercial prices also exhibit some seasonality, but to a much lesser extent.
Principal contributor: Katie Teller
Tags: natural gas, prices