
Rail shipments of oil and petroleum products through October up 13% over year-ago period
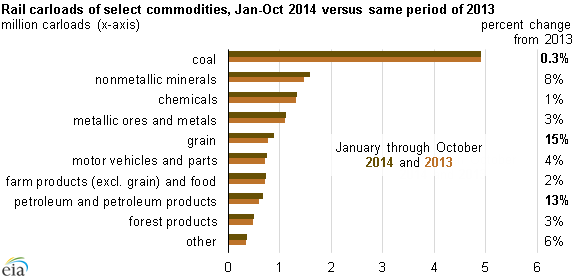
Note: These carloadings do not include intermodal traffic.
U.S. rail traffic, including carloadings of all commodity types, has increased 4.5% through October 2014 compared to the same period in 2013. Crude oil and petroleum products had the second-biggest increase in carloadings through the first 10 months of this year, with these shipments occurring in parts of the country where there is also strong demand to move coal and grain by rail. In response to shipper concerns over the slow movement of crude oil, coal, grain, ethanol, and propane, federal regulators are closely tracking service among the major U.S. freight railroad companies.
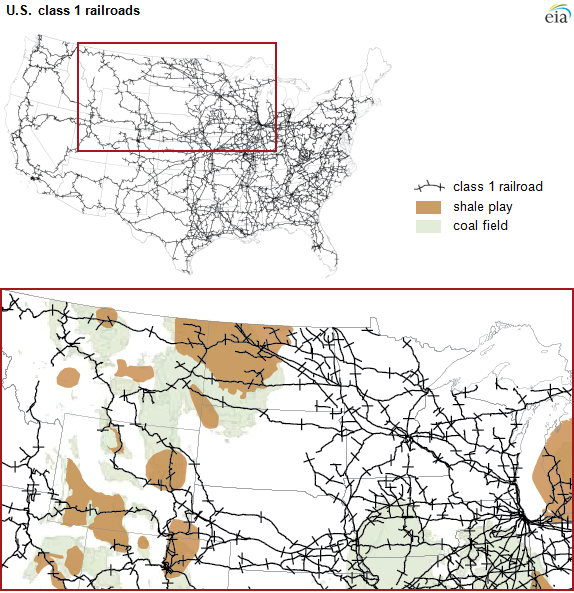
Rail carloadings of oil and petroleum products totaled 672,118 tank cars during January-October 2014, 13.4% higher compared to the same period last year, according to the Association of American Railroads (AAR). Rising U.S. crude oil production, particularly in North Dakota's Bakken Shale formation, where pipeline takeaway capacity is limited in moving the state's growing oil volumes to market, is one of the main reasons for this increase in rail shipments of petroleum and petroleum products.
Rail shipments of coal were up a relatively small 0.3% during the same period, but coal is still by far the largest commodity volume moved by rail, with 4.9 million carloadings. Power plant operators are seeking more coal deliveries by rail to rebuild their coal stockpiles, which were drawn down during last winter's colder-than-normal weather. Rail also moves U.S. coal to various points for export. At the national level, coal exports were down nearly 16% during the first half of this year, but coal exports from the Seattle Customs District (mostly sourced from Wyoming's Powder River Basin) were up 2.4% during the first half of 2014.
Increased movement of grain represents the biggest commodity increase in rail traffic so far this year, up about 15% to 878,824 carloadings, according to AAR. The U.S. Department of Agriculture (USDA) forecasts a record harvest of corn and soybean crops this year. Harvesting of these crops is well underway in the major growing areas in the northern Great Plains states, according to USDA's crop progress reports.
On October 22, the U.S. Department of Transportation's Surface Transportation Board (STB) began requiring major freight rail carriers to file weekly updates on their service performance in delivering goods and commodities. These filings will lead to a better understanding of commodity movements by rail and the potential issues associated with increased demand from multiple types of commodities.
Principal contributor: Tom Doggett
Tags: biofuels, coal, crude oil, electricity, HGL (hydrocarbon gas liquid), liquid fuels, map, propane, rail