
Electric generators' roles vary due to daily and seasonal variation in demand
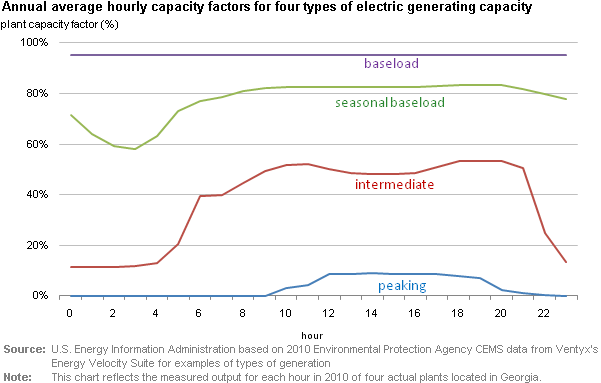
As demand varies over the day, different generators play different roles in meeting demand. Baseload capacity runs around the clock when it is not down for maintenance. Peaking capacity runs a few times a year for short periods to help electricity systems meet peak demand.
Daily demand for electricity is greater during the middle of the day than at night. Intermediate capacity runs during the day and is turned down or off at night. Seasonal demand for electricity is greater in the summer and winter than in the spring and fall. Some generators run as baseload capacity most of the year, but cycle on and off like intermediate capacity during the spring and fall low-demand seasons. These generators could be identified as seasonal baseload capacity.
One way to show these generator roles is to look at hourly unit output data averaged over a year. These data are available from the U.S. Environmental Protection Agency's (EPA) Continuous Emission Monitoring System (CEMS). The chart shows, for each hour of the day, the average output of four units over the year 2010 divided by the plant's maximum possible output. This ratio is known as the plant's capacity factor.
The 2,301 megawatt (MW) Vogtle nuclear plant has a 95% capacity factor for each hour of the day (purple line). This means that when it's running, it is running at full capacity every hour of the day. This is because nuclear capacity has very low variable costs.
The 3,400 MW Scherer coal-fired plant is one of the lowest variable cost coal plants in the Southern Company system. It burns inexpensive, low sulfur coal from the Powder River Basin. It is a baseload plant that produces at full capacity when it is available most of the year (green line). For most of the hours of the day, Scherer's capacity factor is over 80%. But at night during the lowest demand times of the year in spring and fall, Scherer's output is reduced, presumably because it's more efficient and cost effective to reduce the output of a baseload coal plant than a nuclear plant, which is also baseload.
The 463 MW Effingham gas-fired combined-cycle plant only runs during the night about 10% of the time (red line). During the day, the plant's capacity factor rises to over 50%. Intermediate capacity is required to ramp up and down over the day to meeting the daily rise and fall in electricity demand.
The 98 MW SOWEGA Power gas turbine peaking unit rarely runs, and, when it does, it is only between 10 a.m. and 8 p.m. (blue line). The annual average of its hourly capacity factor tops out at only 9% in the middle of the day. Typically, peaking capacity is expensive to run and is called on only during very high demand hours, particularly during heat waves in the summer.