
U.S. consumers’ energy spending rose this winter
Republished May 21, 2014, 1:25 pm, text was added to clarify content.
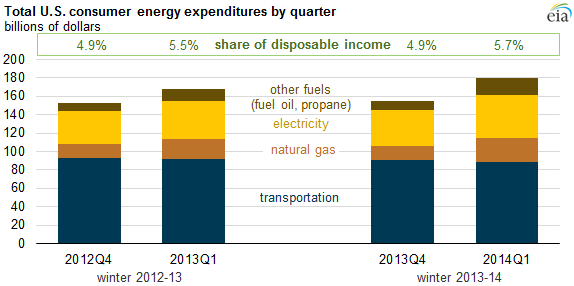
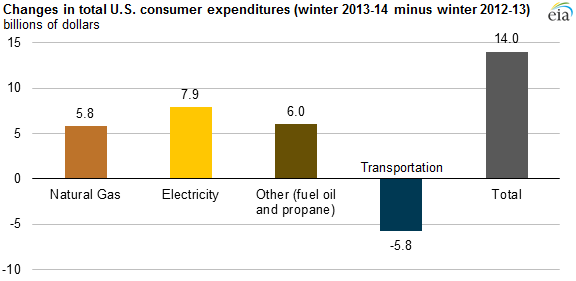
U.S. consumer energy expenditures this past winter (fourth quarter of 2013 and first quarter of 2014) were $14.0 billion (4.4%) higher than the previous winter, as cold weather east of the Rocky Mountains led consumers to pay more to heat their homes but less to fuel their cars. Energy expenditures as a share of disposable income increased 0.1% from the winter of 2012-13 to last winter, with most of the growth occurring in the first quarter of 2014.
Transportation fuels account for the largest contribution to consumer energy expenditures, followed by electricity, natural gas, and heating oil and propane. Energy expenditures vary by season and with market conditions, and are a function of the prices and consumption of each type of energy.
- Transportation fuel expenses declined $5.8 billion (-3%) last winter compared with the previous winter, as prolonged bad weather reduced driving and gasoline consumption. The transportation fuel share, which can represent more than two-thirds of energy expenditures during the summer when motorists drive the most, declined from 58% in the winter of 2012-13 to 54% last winter.
- Electricity expenditures increased $7.9 billion (10%) last winter compared with the previous winter. Electricity expenditures include expenses for utilities and are highest during the summer months when air conditioning boosts electricity demand. Nearly two-thirds of the homes that use electricity as their main heating fuel are concentrated in the South, which has lower heating demand than other parts of the nation.
- Natural gas expenditures increased by $5.8 billion (16%) last winter compared with the previous winter. Natural gas expenditures, which typically peak in the first quarter of each year because of heating demand, also include the cost of using other natural gas appliances such as water heaters and clothes dryers.
- Heating oil and propane expenditures together were $6.0 billion (27%) higher than the previous winter. Heating oil and propane make the smallest contribution to aggregate energy expenditures because they are used predominantly for space heating and are used to heat a relatively small number of homes across the country. However, their use is concentrated in areas of the country that were hit the hardest with cold weather this past winter.
For analysis of heating expenditures of individual households, see the March 12, 2014 edition of Today in Energy.
Principal contributor: Stacy MacIntyre
Tags: electricity, heating oil, natural gas, transportation