U.S. Energy Information Administration logo
Skip to sub-navigation
March 25, 2014

Coal supplies at electric power plants drawn down in cold weather
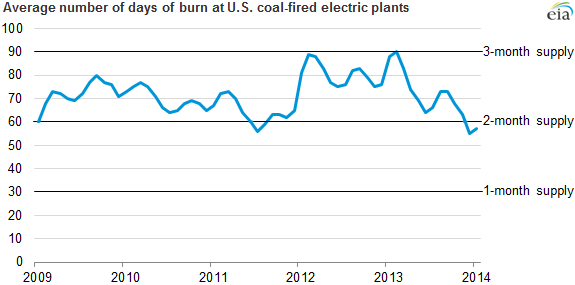
graph of average number of days of burn at U.S. coal-fired electric plants, as explained in the article text
Source: U.S. Energy Information Administration, Electricity Monthly Update, March edition

The average supply of coal held at electric power generators in December 2013 dropped below 60 days of burn (a function of both inventory levels and anticipated consumption) for the first time since summer 2011. Inventory increased slightly in January but remains below a two-month supply. Coal consumption to generate electricity grew during summer and fall 2013 as the price of natural gas, a competing power generation fuel, increased from low levels in 2012. Consumption of coal increased further this winter due to bitter cold weather that drove up power demand.

As coal regained generation market share from natural gas, operators of coal-fired plants drew down inventory levels that had grown abnormally high in late 2012 and early 2013. Receipts of new coal supplies at electric power plants were generally below the five-year range throughout 2013 (see graph below), leading to low inventory heading into this spring.
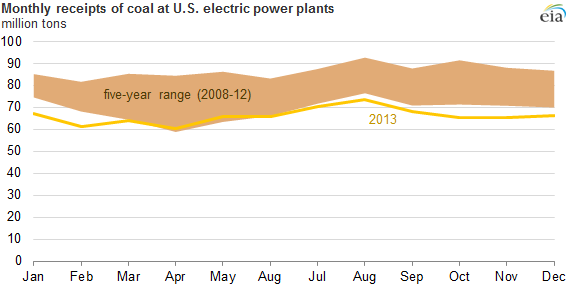
graph of monthly receipts of coal at U.S. electric power plants, as explained in the article text
Source: U.S. Energy Information Administration, Electric Power Monthly, March edition

Over 80% of coal used by electric generators is purchased under multiyear contracts, which give buyers limited options for adjusting delivery volumes. The main avenue buyers have in reacting to short-term market developments is to replace expiring multiyear contracts with shorter-term spot coal supplies. This strategy gives generators more control over the rate of receipts. As shown below, the percent of coal receipts purchased on spot contracts rose throughout 2013.
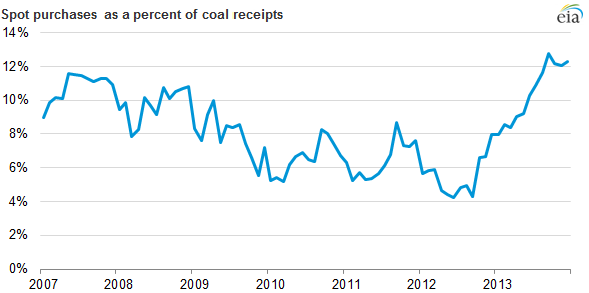
graph of spot purchases as a percent of coal receipts, as explained in the article text
Source: U.S. Energy Information Administration, Electric Power Monthly, March edition

Principal contributor: M. Tyson Brown

Statistics
Analysis
Tools
Education
News

Petroleum & Other Liquids

Crude oil, gasoline, heating oil, diesel, propane, and other liquids including biofuels and natural gas liquids.

Natural Gas

Exploration and reserves, storage, imports and exports, production, prices, sales.

Electricity

Sales, revenue and prices, power plants, fuel use, stocks, generation, trade, demand & emissions.

Coal

Reserves, production, prices, employment and productivity, distribution, stocks, imports and exports.

Nuclear & Uranium

Uranium fuel, nuclear reactors, generation, spent fuel.

Renewable & Alternative Fuels

Includes hydropower, solar, wind, geothermal, biomass and ethanol.

EIA Survey Forms

Forms EIA uses to collect energy data including descriptions, links to survey instructions, and additional information.

Total Energy

Comprehensive data summaries, comparisons, analysis, and projections integrated across all energy sources.

U.S. States

State energy information, including overviews, rankings, data, and analyses.

International

International energy information, including overviews, rankings, data, and analyses.

Environment

Greenhouse gas data, voluntary reporting, electric power plant emissions.

Data Tools, Apps, & Maps

Tools to customize searches, view specific data sets, study detailed documentation, and access time-series data.

Open Data

EIA's free and open data available as API, Excel add-in, bulk files, and widgets

EIA Beta

Come test out some of the products still in development and let us know what you think!

Open Source Code

EIA's open source code, available on GitHub.

RSS Feeds

Subscribe to feeds for updates on EIA products including Today in Energy and What's New.