
Higher wind generation in the Southwest Power Pool is reducing use of baseload capacity
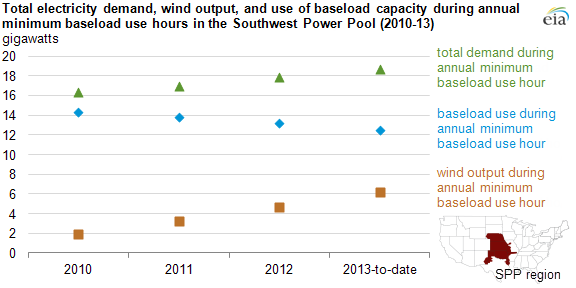
Because of growing output from wind generators, the value and use of electric baseload capacity is declining in the Southwest Power Pool (SPP). In the chart above, the use of baseload capacity, which includes units that run near full capacity at all times, is represented by the minimum of the hourly difference between total demand and wind output. This value has come down in each of the last three years in SPP, as wind generation has supplanted baseload generation, typically from nuclear and coal units.
The wind output during the hour when the difference between hourly demand and wind output was at its yearly minimum has increased each year since 2010 as has the yearly average and maximum hourly wind output. Wind generating capacity in SPP doubled between June 2010 and June 2013, from 3.4 gigawatts (GW) to 6.8 GW.
The declining hourly difference between total demand and wind output has occurred even though the total hourly demand during the annual minimum baseload use hour in SPP has been risen each year.
A previous Today in Energy article showed that a proxy for the size of baseload electricity service can be estimated as the minimum of hourly demand. A more accurate estimate of baseload service also considers the hourly output of variable energy resources, such as wind, solar, and hydro under certain circumstances. System operators have limited ability to control the output of these supply resources, which are generally dispatched when it is windy, sunny, or when water levels behind dams dictate flow.
The difference between hourly demand and wind output reached its minimum level in 2010 on April 25 for the hour between 3:00 a.m and 4:00 a.m. (see chart below left). The difference between hourly demand and wind output reached its minimum level so far in 2013 on April 6 for the hour between 2:00 a.m and 3:00 a.m. (see chart below right). The difference may get even smaller in 2013 because in 2011 and 2012 this minimum occurred in the fall.
The minimum hour for use of baseload capacity has been occurring in the spring or fall shoulder periods—when electricity demand is typically at its lowest. Baseload generating units are periodically taken offline for planned maintenance during the shoulder periods. This timing for maintenance is particularly true for nuclear units. As a result, the lowest values for the difference between demand and wind output often coincide with shoulder periods when some baseload capacity is offline anyway.
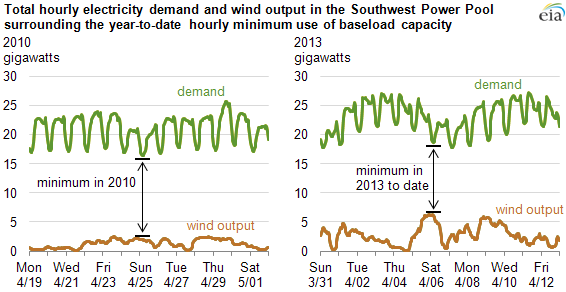
Note: The 2010 range is Sunday, April 18 to Saturday, May 1. The 2013 range is Sunday, March 31 to Friday, April 12.