
Proved reserves of crude oil and natural gas in the United States up sharply in 2011
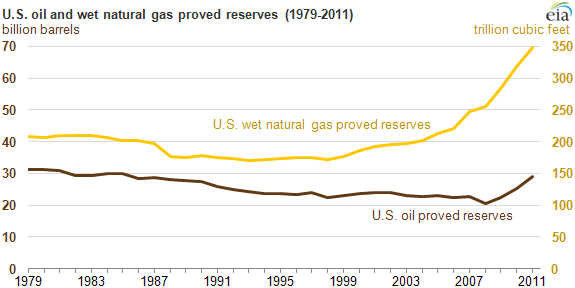
Note: Proved reserves are measured as of December 31.
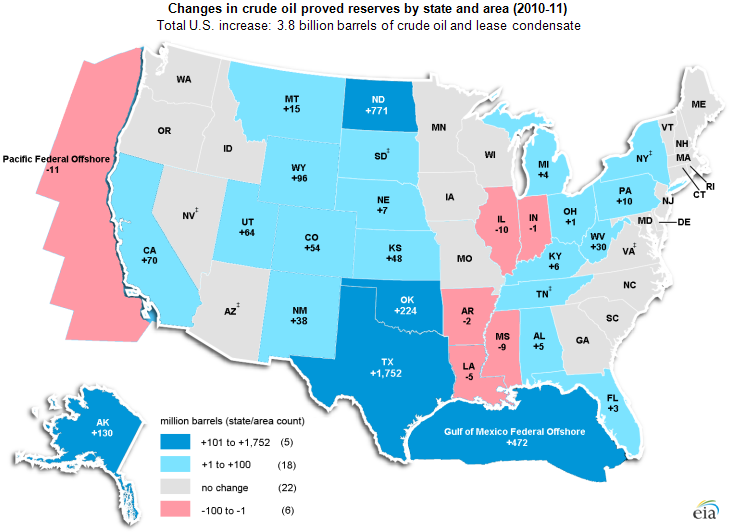
U.S. proved crude oil reserve additions in 2011 set a record volumetric increase for the second year in a row, according to newly published estimates in EIA's U.S. Crude Oil and Natural Gas Proved Reserves, 2011. Natural gas proved reserve additions fell short of setting a record, but still ranked as the second largest annual increase since 1977. Crude oil reserves rose 15% (almost 3.8 billion barrels) to the highest level since 1985, and natural gas reserves were up almost 10% (31.2 trillion cubic feet).
Proved oil reserves, which include crude oil and lease condensate, increased to 29.0 billion barrels, marking the third consecutive annual increase and the highest volume of proved reserves since 1985. Proved reserves in tight oil plays accounted for 3.6 billion barrels (13%) of total proved reserves of crude oil and lease condensate in 2011.
Texas recorded the largest increase in proved oil reserves among individual states, largely because of continuing development in the Permian Basin and the Eagle Ford formation in the Western Gulf Basin. North Dakota had the second largest increase, driven by development activity in the Bakken formation in the Williston Basin.
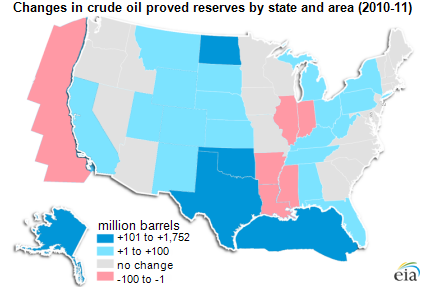
Note: EIA's estimates of proved reserves are based on an annual survey of domestic oil and gas well operators. ‡ Data withheld to avoid disclosure of individual company data.
Note: Click to enlarge.
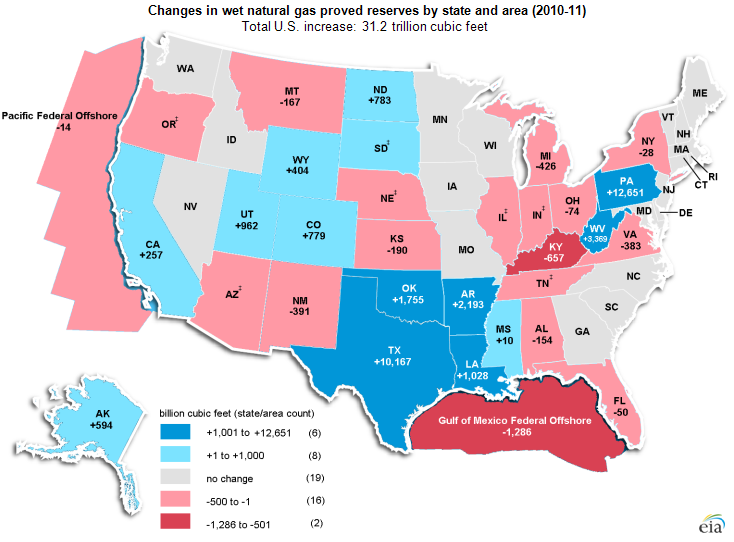
Combined, Texas and Pennsylvania added 73% of the net increase in proved wet natural gas reserves in 2011. Pennsylvania's proved natural gas reserves, which more than doubled in 2010, increased by 12.7 trillion cubic feet in 2011, contributing 41% of the overall gain in proved reserves. Proved reserves in shale gas plays accounted for 131.6 trillion cubic feet (38%) of total proved reserves of wet natural gas in 2011.
Natural gas proved reserves, estimated as wet gas that includes liquids in the natural gas stream, increased by almost 10% in 2011 to 348.8 trillion cubic feet (Tcf), the 13th consecutive annual increase.
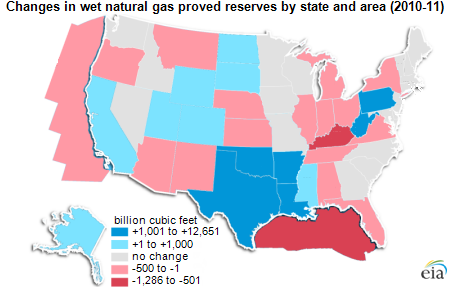
Note: EIA's estimates of proved reserves are based on an annual survey of domestic oil and gas well operators. ‡ Data withheld to avoid disclosure of individual company data.
Note: Click to enlarge.
For more details see the full report on U.S. Crude Oil and Natural Gas Proved Reserves, 2011. Additional state-level data are presented in the report, including estimates of proved reserves from selected tight oil and shale gas plays.
Tags: crude oil, map, natural gas, reserves, states