
Future power market shares of coal, natural gas generators depend on relative fuel prices
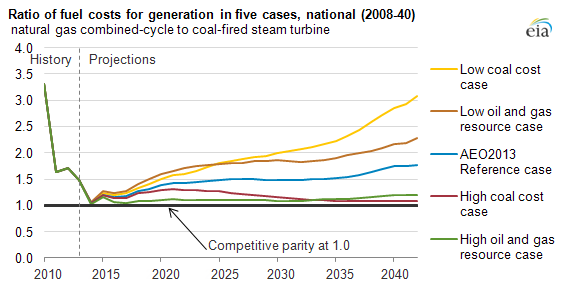
Note: This ratio compares fuel-related power plant operating costs per MWh, and not the cost per-MMBtu of the fuel itself. The per-MWh operating cost includes an average efficiency (heat rate) for each technology. Since combined-cycle units are more efficient than steam turbines alone, this ratio may be near 1.0 even if natural gas prices are higher than those for coal on a dollar per MMBtu basis.
In recent years, natural gas competed more effectively with coal as a fuel for electricity generation as the cost of operating natural gas-fired generators fell below the cost of operating coal-fired generators in some regions, changing the least-cost dispatch ordering of available units. EIA's most recent outlook shows how generation market shares respond to changing fuel prices.
In 2012, the national average per-megawatthour costs for producing electricity from coal steam plants and natural gas combined-cycle plants were nearly equal. In the Reference case forecast (shown in the graph above), natural gas plants begin to lose competitive advantage over time as natural gas prices increase relative to coal prices. Because fuel prices vary by region and because considerable variation in efficiencies exists across the fleets of both coal-fired plants and combined-cycle plants, continued competition for dispatch between coal and natural gas is expected, even in the Reference case.
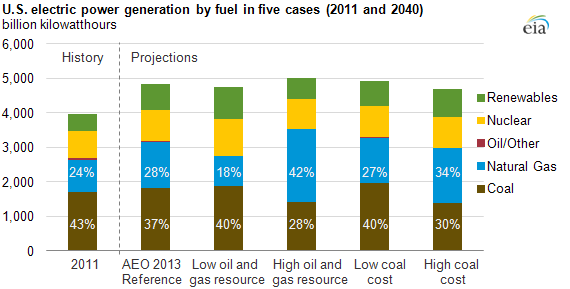
The coal and natural gas shares of total electricity generation vary widely across the alternative cases. The coal share of total generation varies from 28% to 40% in 2040, and the natural gas share varies from 18% to 42% (see graph below). In the High Oil and Gas Resource case, natural gas becomes the dominant generation fuel after 2015, and its share of total generation is 42% in 2040.
There is significant uncertainty about future coal and natural gas prices. Higher coal prices or lower natural gas prices give natural gas combined-cycle plants more opportunities to displace coal-fired generators. In Annual Energy Outlook (AEO2013), for both the High Coal Cost case and the High Oil and Gas Resource case (characterized by low natural gas prices), average natural gas combined-cycle units are close to or more economical than average coal steam turbines.
Regional results: Southeast
The southeastern subregion of the SERC Reliability Corporation (SERC; mapped below) has a particularly efficient fleet of natural gas combined-cycles plants and faces high transportation costs to move low-cost coal from western mines. The projected fuel ratios for both the High Coal Cost case and the High Oil and Gas Resource case indicate that competition will remain strong in this region, with ratios near or below the 1.0 line (competitive parity) for the majority of the projection period.
While average coal steam turbine efficiencies remain largely static over the projection period in the Southeast, the efficiency of the average natural gas combined-cycle unit increases appreciably by 2040, becoming among the most efficient in the nation. In this region, the natural gas share of total electric power generation in 2040 is 36% in the Reference case and 56% in the High Oil and Gas Resource case.
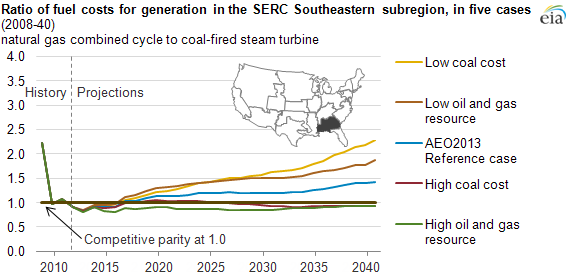
Note: This ratio compares fuel-related power plant operating costs per MWh, and not the cost per-MMBtu of the fuel itself. The per-MWh operating cost includes an average efficiency (heat rate) for each technology. Since combined-cycle units are more efficient than steam turbines alone, this ratio may be near 1.0 even if natural gas prices are higher than those for coal on a dollar per MMBtu basis.
Regional results: Midwest
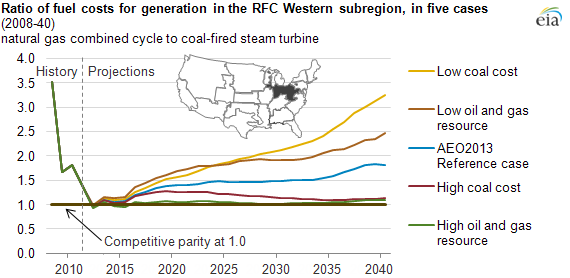
In the western portion of the ReliabilityFirst Corporation (RFC) region (mapped below), which covers Ohio, Indiana, and West Virginia as well as portions of neighboring states, the situation is somewhat different.
In the High Coal Cost case, a limited amount of generation shifts from coal to natural gas in this region because it has a large amount of existing coal-fired capacity as well as access to multiple coal sources, including western, Illinois, and Appalachian basins. The ability to switch coal sources to control fuel expenditures reduces the incentive to build new natural gas combined-cycle generators, even under higher coal price conditions.
The coal share of total capacity in the Midwest is projected to fall to 48% in 2040 in the Reference Case, with the retirement of nearly 15 GW of coal-fired capacity by 2017. However, that capacity is projected to continue to provide more than 60% of electricity generation in the power sector. Natural gas combined-cycle capacity represented only 7% of total capacity in the region in 2011, but is projected to rise to 11% in 2040 in the Reference Case.
Note: This ratio compares fuel-related power plant operating costs per MWh, and not the cost per-MMBtu of the fuel itself. The per-MWh operating cost includes an average efficiency (heat rate) for each technology. Since combined-cycle units are more efficient than steam turbines alone, this ratio may be near 1.0 even if natural gas prices are higher than those for coal on a dollar per MMBtu basis.
For details of the complete analysis, see the full Issues in Focus article.