Natural gas demand at power plants was high in summer 2012
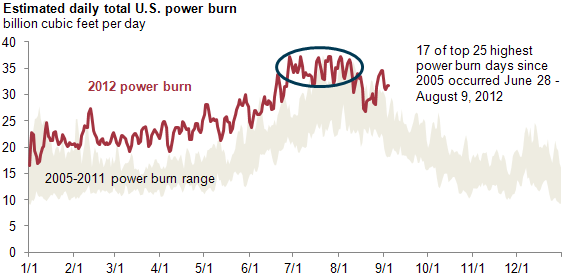
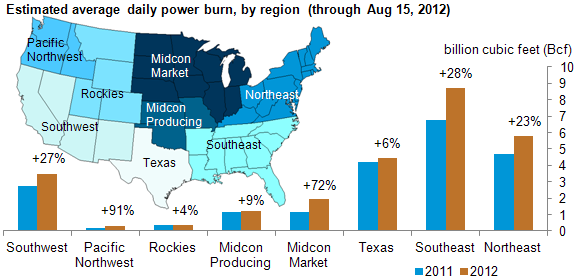
Natural gas use for power generation rose this summer because of hot-weather-driven electricity demand for air conditioning coupled with low natural gas prices. According to Bentek Energy, estimated daily natural gas use to produce electric power (also called power burn) averaged 26.3 billion cubic feet per day (Bcf/d) so far in 2012 (Jan 1 - Aug 15), up 24% compared to the same period for 2011. Bentek Energy, which has been estimating power burn since January 2005, said that 17 of the 25 highest days of power burn since 2005 occurred this summer between June 28 and August 9.
The two main drivers of the increased use of natural gas at power plants this year are weather and a structural shift toward generating more electricity from natural gas-fired power plants.
The National Oceanic and Atmospheric Administration reported the warmest first half of the year since 1895 in 28 states, and that heat continued in July and August. U.S. population-weighted cooling degree days (CDDs), a measure of cooling requirements, averaged 26% higher than the 30-year average from January 1 through August 15, and has been consistently above average for most of the year. Regionally, CDDs in the Midwest, where hot, dry weather was particularly severe, were 59% above their 30-year average, with the Northeast, South, and West at 43%, 18%, and 14%, respectively, above their corresponding averages.
In April 2012, EIA reported that monthly shares of coal- and natural gas-fired generation were equal for the first time. This is a result of several factors, including:
- Lower natural gas prices, the result of new drilling technologies, growing production, a large increase in proved reserves, and robust natural gas infrastructure additions over the last several years.
- Power plant efficiencies, with newer natural gas units more efficient than older coal units and rising capacity factors of natural gas-fired units.
- Coal unit retirements, expecting almost 9,000 MW of coal-fired capacity to be retired in 2012, with additional retirements in subsequent years.