
EIA forecasts East Coast gasoline inventories will build by the end of 2022
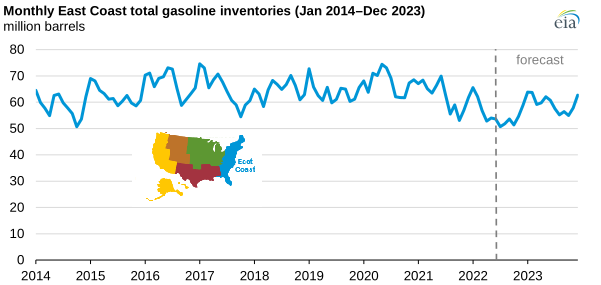
In our September 2022 Short-Term Energy Outlook, we forecast that monthly East Coast gasoline inventories will generally increase from July’s multiyear lows. We forecast gasoline inventories will build by the end of 2022 and remain higher than July's low throughout 2023.
East Coast gasoline inventories in July 2022 were the lowest since October 2014 and remain low as a result of a number of factors affecting supply. One significant factor is Russia’s full-scale invasion of Ukraine, which has disrupted global petroleum product trade and increased competition for fuel supplies in the Atlantic Basin. As a result, less gasoline was imported into the East Coast in 2022 compared with prior years. On average, 24% less motor gasoline was imported into the United States during the first half of 2022 than during the first half of 2021. Another significant factor affecting supply is decreased petroleum production capacity on the East Coast. The Philadelphia Energy Solutions refinery closed in 2019, and the Come-by-Chance refinery in Newfoundland, Canada, was idled in 2020. Between 2018 and 2021, the capacity to produce petroleum on the East Coast declined by about 400,000 barrels per day. Although shipments of petroleum products from the U.S. Gulf Coast to the East Coast have been higher than average, further increases in these shipments are limited by transportation constraints.
We estimate that East Coast gasoline inventories have already begun to increase from their July 2022 lows, and we forecast that they will remain above July lows for the rest of 2022. We estimate East Coast gasoline inventories increased by 1.1 million barrels to 51.8 million barrels from July to August 2022. We forecast that East Coast gasoline inventories will increase to 63.8 million barrels for January 2023.
Much of the increase in our forecast inventory over the next few months is due to typical seasonal factors. Less gasoline is consumed in the United States in the fall and winter than in the summer, when drivers tend to travel more. In addition, futures prices for RBOB, the petroleum component of gasoline used in many parts of the country, are generally higher for summer-month delivery than for winter-month delivery. This seasonal structure in RBOB futures prices encourages market participants to build inventory in the fall and winter, before the high-demand summer months.
Although our forecast that inventory will grow in the fourth quarter of 2022 is typical of the season, we forecast the build to be above average, in part, because we expect less demand than on average.
East Coast gasoline inventories will likely remain around 60 million barrels until June 2023 after reaching a peak of 64 million barrels in January 2023. We forecast inventories will decrease to around 55 million barrels during the peak driving demand season in July and August 2023. We expect inventories to return to more than 60 million barrels by the end of 2023.
Principal contributor: Jimmy Troderman