
Gas use for power generation leads increase in natural gas use in 2010
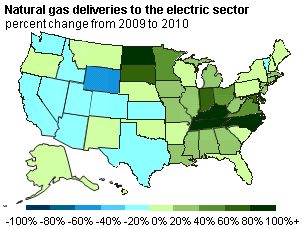
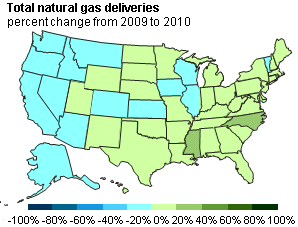
Natural gas use for power generation rose 7%, or about 515 billion cubic feet (Bcf), between 2009 and 2010, according to EIA. Most of the gains in the power sector were in the Eastern half of the country (see map above left). Total natural gas deliveries to consumers in the United States grew about 4 % to around 22 trillion cubic feet (Tcf) for 2010. Use of natural gas in the industrial sector was up by 6% in 2010 but from a lower base than in the electric power sector. Natural gas deliveries to residential and commercial consumers, on the other hand, were relatively unchanged from their 2009 levels.
The biggest changes in natural gas use occurred in the Southeast United States, where state-level natural gas deliveries from 2009 to 2010 increased by between 5% and 24% (see map above right). Historically low natural prices, coupled with weather-driven demand in the Southeast, increased natural gas deliveries for electricity generation. This region, which is highly dependent on natural gas-fired generation for electricity, experienced 17% higher heating degree days in the winter and 23% higher cooling degree days in summer compared to 30-year normal ranges. In the Western United States, natural gas deliveries decreased in most states. Increased hydroelectric generation in the Pacific Northwest along with a cooler-than-normal summer weather contributed to reduced natural gas demand for electricity generation in the region.
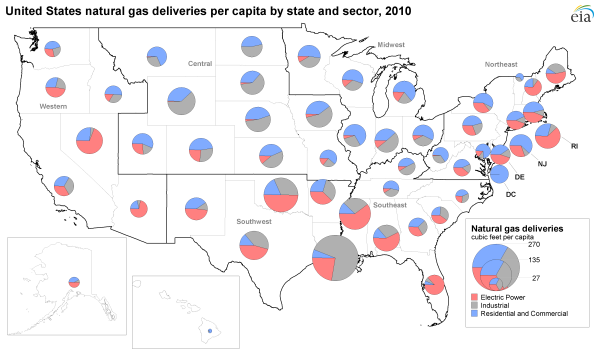
In 2010, Louisiana led the nation in per-capita natural gas consumption overall due to a combination of its modest population of 4.5 million and the size of its industrial gas deliveries (see map below). The map also shows that, on a per-capita basis, by sector:
- Gas use for power dominates in Florida, Nevada, Arizona, New Hampshire, and Mississippi.
- Residential and commercial gas use together anchors deliveries in Northern-tier states such as Michigan, Wisconsin, Minnesota, Illinois, and Montana.
- Along with Louisiana, industrial gas use accounted for the majority of 2010 deliveries in interior states such as Iowa, Nebraska, North Dakota, South Dakota, and Wyoming.
Tags: commercial, consumption/demand, electricity, industrial, map, natural gas, residential, states