U.S. Energy Information Administration logo
Skip to sub-navigation
December 15, 2011

Market changes contribute to growing Marcellus area spot natural gas trading
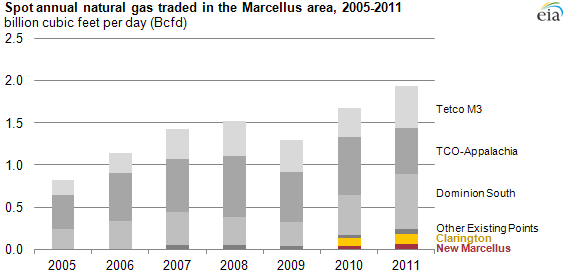
graph of Spot annual natural gas traded in the marcellus area, 2005-2011, as described in the article text
Source: U.S. Energy Information Administration, based on Ventyx's Energy Velocity Suite.
Note: New Marcellus in the graph includes the Leidy, TGP 219, TGP 313, and TGP Zone 4 Marcellus trading points. 2011 includes data through November.

Marcellus-area spot natural gas trading (InterContinentalExchange (ICE) day-ahead transactions) has more than doubled from under 1 billion cubic feet per day (Bcfd) to almost 2 Bcfd on average since 2005 (see chart). The largest gains in Marcellus area trading volumes were at the Tetco M3 trading point, up 178% to 0.5 Bcfd and at the Dominion South trading point, up 168% to 0.7 Bcfd since 2005. Key factors likely contributing to increased natural gas spot trading in the Marcellus area include: rapid increases in Marcellus shale gas production; direct deliveries of Wyoming gas to the Ohio/Pennsylvania border through the Rockies Express Pipeline; and increased use of natural gas for power generation.

Several factors are likely contributing to increased natural gas spot trading in the Marcellus area:

  • Marcellus production gains. Bentek Energy, LLC estimates that Marcellus natural gas production now exceeds 4 Bcfd, up significantly in recent years.
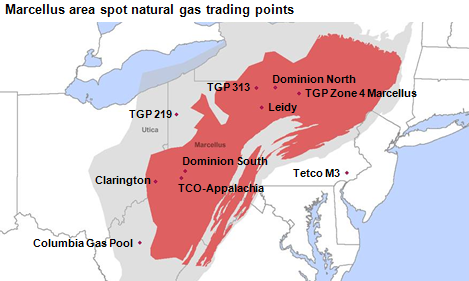
  • New trading points. In addition to several new Marcellus production area trading points, the extension of the Rockies Express Pipeline (REX) to Clarington, Ohio led to new natural gas trading points formed to facilitate commercial transactions. REX deliveries to Clarington, Ohio averaged over 1 Bcfd from January through December of 2011.
  • Greater reliance on natural gas for electricity generation. Falling natural gas prices coupled with historically high spot coal prices created incentives for generators to use more natural gas to fuel their plants. Pennsylvania is one state that has seen significant growth in natural gas-fired electric generation.
map of Marcellus area spot natural gas trading points, as described in the article text
Source: U.S. Energy Information Administration, based on Ventyx's Energy Velocity Suite.

Statistics
Analysis
Tools
Education
News

Petroleum & Other Liquids

Crude oil, gasoline, heating oil, diesel, propane, and other liquids including biofuels and natural gas liquids.

Natural Gas

Exploration and reserves, storage, imports and exports, production, prices, sales.

Electricity

Sales, revenue and prices, power plants, fuel use, stocks, generation, trade, demand & emissions.

Coal

Reserves, production, prices, employment and productivity, distribution, stocks, imports and exports.

Nuclear & Uranium

Uranium fuel, nuclear reactors, generation, spent fuel.

Renewable & Alternative Fuels

Includes hydropower, solar, wind, geothermal, biomass and ethanol.

EIA Survey Forms

Forms EIA uses to collect energy data including descriptions, links to survey instructions, and additional information.

Total Energy

Comprehensive data summaries, comparisons, analysis, and projections integrated across all energy sources.

U.S. States

State energy information, including overviews, rankings, data, and analyses.

International

International energy information, including overviews, rankings, data, and analyses.

Environment

Greenhouse gas data, voluntary reporting, electric power plant emissions.

Data Tools, Apps, & Maps

Tools to customize searches, view specific data sets, study detailed documentation, and access time-series data.

Open Data

EIA's free and open data available as API, Excel add-in, bulk files, and widgets

EIA Beta

Come test out some of the products still in development and let us know what you think!

Open Source Code

EIA's open source code, available on GitHub.

RSS Feeds

Subscribe to feeds for updates on EIA products including Today in Energy and What's New.