
EIA’s Hourly Electric Grid Monitor shows effects of California wildfire-related shutoffs
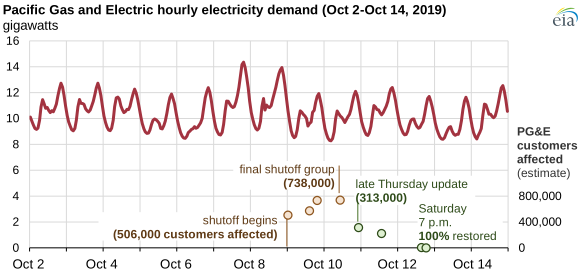
Starting on Wednesday, October 9, 2019, California electric utility Pacific Gas and Electric (PG&E) shut off electricity to hundreds of thousands of customers in 34 California counties. PG&E had restored electricity to all of those customers by Saturday, October 12. PG&E attributed its decision to shut off electricity to gusty winds and dry conditions in the area, which increases the risk of fires that could be caused or exacerbated by damaged power lines and other electric equipment. The U.S. Energy Information Administration’s (EIA) Hourly Electric Grid Monitor shows the effect of the shutoff event within PG&E and on the larger electric grid system in California.
PG&E provides electricity service to 5.5 million customers in California, according to EIA’s latest annual survey of the U.S. electric power industry. In 2018, PG&E was the largest electric utility in the United States in terms of revenue generated and number of electricity customers. PG&E sold more than 80 million megawatthours of electricity to customers last year, making it the sixth-largest electric utility in the United States, and the second largest in California (behind Southern California Edison) in terms of electricity retail sales.
The magnitude of the shutoff event is visible in EIA’s Hourly Electric Grid Monitor—EIA’s product that combines data series published by 65 electricity balancing authorities (the entities that manage the electricity grid operations) in the United States. PG&E is one of the four subregions of the larger California Independent System Operator (CAISO), which manages much of the electricity in California.
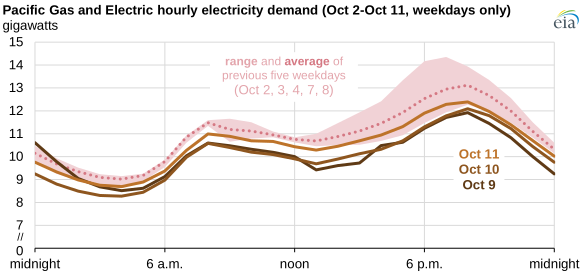
About 738, 000 PG&E customers were affected, about 13% of PG&E’s total customer base. Electricity was shut off in four groups starting at midnight on Wednesday, October 9. Later that day, PG&E's electricity load was about 13% lower than comparable hourly demand, based on the average of the five weekdays before the event. Other factors—especially temperature—affect electricity demand, making the precise effect of the shutoff difficult to discern.
Wednesday—the first day of the shutoff—was likely the day when electricity demand was most affected. By the evening of Thursday, October 10, PG&E had restored electricity to more than half of the affected customers, according to updates posted to PG&E’s website. By Saturday evening, PG&E had restored electricity to all of its customers and electricity demand was back to relatively normal levels.
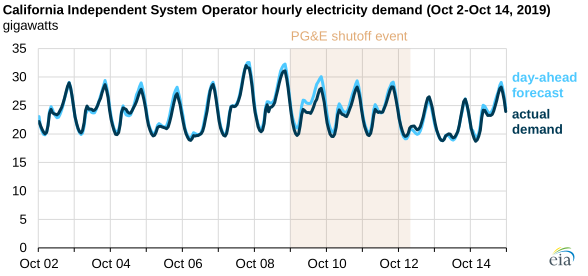
The event is also visible in the larger CAISO hourly electricity demand series. Each day, balancing authorities such as CAISO provide their anticipated electricity demand for each hour of the upcoming day. On the afternoon of the first day of the shutoff (Wednesday, October 9), CAISO system demand was 7% to 10% lower than the day-ahead forecast demand series for those hours.
Principal contributor: Owen Comstock
Tags: electricity, weather, California, states