
U.S. oil and natural gas proved reserves declined in 2015 because of lower prices
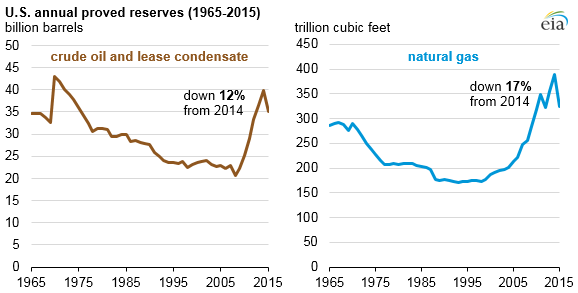
U.S. crude oil proved reserves declined 4.7 billion barrels (11.8%) from their year-end 2014 levels to 35.2 billion barrels at year-end 2015, according to EIA’s recently released U.S. Crude Oil and Natural Gas Proved Reserves report. U.S. natural gas proved reserves decreased 64.5 trillion cubic feet (Tcf), a 16.6% decline, reducing the U.S. total to 324.3 Tcf at year-end 2015.
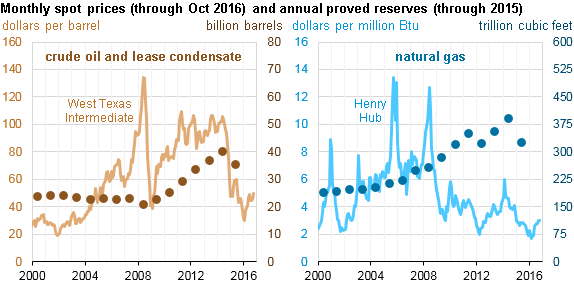
The significant reduction in the average price of both oil and natural gas between 2014 and 2015 resulted in more challenging economic and operating conditions, important factors in determining proved reserves. West Texas Intermediate crude oil spot prices declined nearly 50% from $94.55 per barrel in 2014 to $50.00 per barrel in 2015. The natural gas spot price at the Louisiana Henry Hub declined more than 40% from $4.55 per million Btu in 2014 to $2.62 per million Btu in 2015. These price reductions led to reduced drilling activity and lower reported proved reserves across a broad range of U.S. producers in 2015.
Proved reserves are volumes of oil and natural gas that geologic and engineering data demonstrate with reasonable certainty to be recoverable under existing economic and operating conditions. Because they depend on economic factors, proved reserves shrink or grow as commodity prices and extraction costs change. EIA bases its estimates of proved reserves on an annual survey of domestic oil and natural gas well operators.
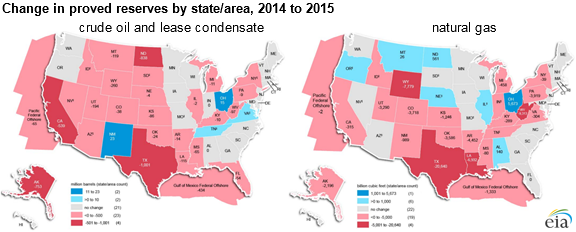
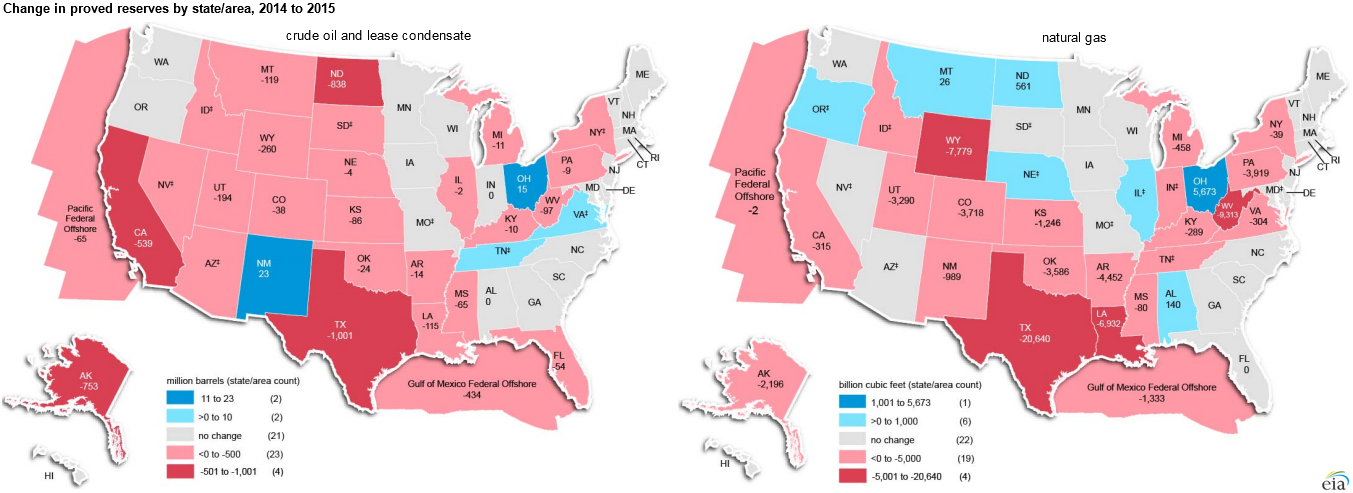
Crude oil and lease condensate reserves decreased in most states in 2015, with the largest net decrease in Texas, followed closely by North Dakota. Texas also had the largest net decrease in natural gas proved reserves.
New Mexico was one of four states that experienced a net increase in proved reserves of crude oil and lease condensate in 2015, mostly from development of the Wolfcamp shale and Bone Spring plays in southeastern New Mexico’s portion of the Delaware Basin.
Ohio added more than 5 Tcf of natural gas proved reserves, mostly from the Utica-Point Pleasant Shale play, and Ohio surpassed Arkansas and the Gulf of Mexico to become the ninth-largest natural gas reserves state.
Note: Click to enlarge.
Principal contributor: Steven Grape
Tags: crude oil, liquid fuels, map, natural gas, reserves, states