
Total U.S. electricity sales projected to grow slowly as electricity intensity declines
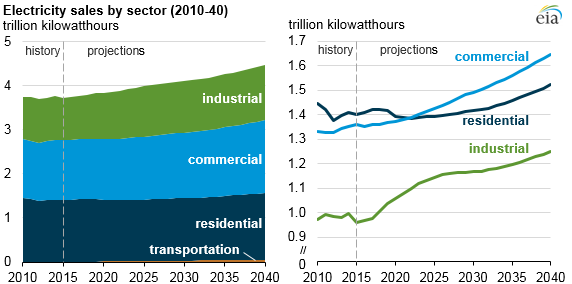
Electricity sales, as projected in the U.S. Energy Information Administration's most recent Annual Energy Outlook (AEO2016) Reference case, increase in each sector through 2040. In 2015, 3.7 trillion kilowatthours (kWh) of electricity were sold, and total electricity sales are projected to rise 0.7% annually through the projection period. The residential sector currently purchases the most electricity, with a 38% share of total electricity sales in 2015. However, sales in the commercial sector are projected to surpass those in the residential sector in the early 2020s.
The AEO2016 Reference case, which reflects current laws and regulations, includes the U.S. Environmental Protection Agency's Clean Power Plan (CPP). The CPP allows state regulators to encourage customers to purchase specified energy-efficient technologies as a part of state compliance strategies. The AEO2016 Reference case assumes that consumers will receive subsidies of 10% or 15% between 2020 and 2025 for certain energy efficient appliances, equipment, and building envelope improvements.
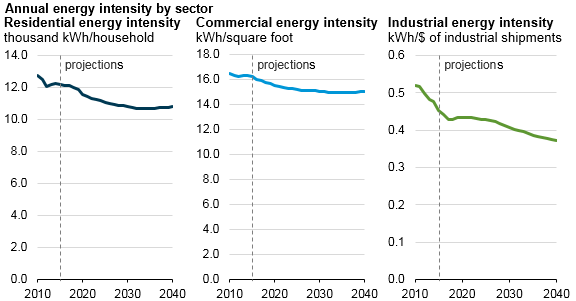
The residential sector currently is the largest electricity-consuming sector, with 1.4 trillion kWh sold in 2015. Electricity sales in the residential sector are projected to grow by 0.3% per year in the Reference case from 2015 through 2040 as the number of households increases by 0.8% per year. Residential energy intensity is expected to decline, with the average purchased electricity per household falling 11.3% from 2015 to 2040. Federal efficiency standards for most major end uses, including lighting, space cooling and heating, and water heating, as well as state and local building energy codes, are the main reasons for the electricity intensity decline.
Electricity sales to commercial consumers are projected to increase at an average annual rate of 0.8% from 2015 to 2040. Commercial sector electricity intensity (electricity sales per square foot of floorspace) is projected to decline 0.3% per year as total commercial sector floorspace increases 1.1% per year. Federal energy efficiency standards, as well as technological improvements in lighting, refrigeration, space heating, and space cooling, contribute to the decline in electricity intensity.
Electricity sales to industrial consumers are projected to rise 1.1% per year on average, from 1.0 trillion kWh in 2015 to 1.2 trillion kWh in 2040. With the value of industrial shipments projected to grow 1.9% per year in the Reference case, industrial sector electricity intensity, or electricity sales per dollar of industrial shipments, declines at an average annual rate of 0.8% from 2015 to 2040. The decline in projected electricity intensity results from the adoption of more energy-efficient technologies and structural changes in the economy toward less electricity-intensive industries.
A recent extension of federal tax credits for residential and commercial solar photovoltaic (PV) systems, combined with the expected continuation of declining PV prices, spurs increased adoption of residential and commercial PV in the AEO2016 Reference case projection. Total building PV capacity grows at 8.6% annually in the AEO2016 Reference case. Generation from residential PV systems reaches 90 billion kWh, and commercial system generation reaches 36 billion kWh by 2040. Residential and commercial electricity sales would be 5.0% and 1.7% higher, respectively, in 2040 without the electricity generated by rooftop PV systems.
Principal contributor: Kimberly Klaiman