
U.S. propane exports increasing, reaching more distant markets
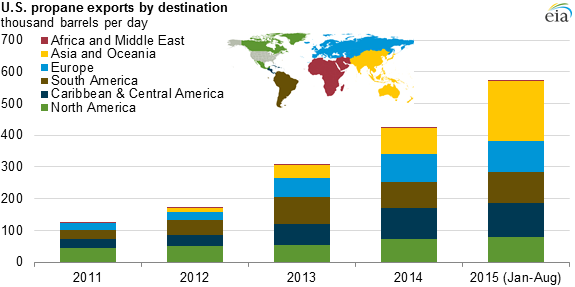
As U.S. propane production has increased and domestic demand has remained relatively flat, the United States has transitioned from being a net propane importer to a net exporter. Facilitated by rapid expansion in the capacity to export domestic supply, propane exports from the United States are changing traditional propane trade patterns across the globe.
The initial growth in U.S. propane production, between 2008 and 2010, led to a reduction in dependence on propane imports, with net imports falling from an average of 109,000 barrels per day (b/d) in 2008 to a near-balance of 16,000 b/d in net exports in 2010. By 2011, only Canada remained as a major supplier of propane into the United States, with imports from other countries relegated to deliveries to Hawaii and occasional shipments into the Northeast.
On the international market, propane prices are typically set by the Saudi Aramco monthly contract price (ACP). Saudi Aramco generally bases its propane price on naphtha, a light petroleum product created through refining crude oil, because naphtha competes with propane as a petrochemical feedstock. In 2005, when the United States was still a net importer of propane, the U.S. price of propane at Mont Belvieu, Texas, averaged a 3 cent per gallon (gal) premium to ACP. Growing U.S. propane exports began to approach the capacity of export terminals, resulting in Mont Belvieu prices that were lower than the international market, averaging an 89 cent/gal discount in 2012. The wide price differential prompted the construction of new export terminal capacity, and as export capacity in the United States grew, the spread between international and U.S. propane prices gradually narrowed.
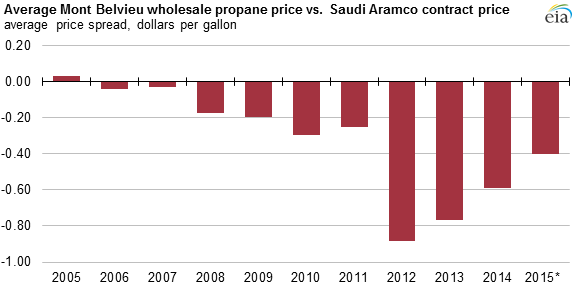
Note: 2015 data are January through September.
U.S. exports of propane initially reached nearby markets in Mexico, the Caribbean, and South America, doubling between 2010 and 2013, from 88,000 b/d to 198,000 b/d. By the latter half of 2013, substantial quantities of U.S. propane exports were being sent to the European market, helping to offset declines in European propane production. U.S. propane exports to Europe have increased from 25,000 b/d in 2012 to nearly 100,000 b/d in 2015 (through August). U.S. propane exports are now competing with Europe's traditional import sources, particularly Russia, North Africa, and the Middle East.
More recently, U.S. propane is increasingly being exported to Asia. U.S. propane exports to Asia nearly tripled in 2015, from 65,000 b/d in the first eight months of 2014 to 189,000 b/d in the same months of 2015. Traditionally, Asia is supplied by imports from the Middle East and by in-region refinery and natural gas plant production. Uses of propane in Asia vary significantly across the region and are also different from other markets. In Asia, the fastest-growing segment of propane demand is the petrochemical sector, with significant growth in propane dehydrogenation (PDH) capacity. If current pricing trends continue, growing petrochemical demand, especially in Asia, will be the primary market for further increases in U.S. propane exports.
Despite these increased exports, the United States remains well-supplied with propane, especially in comparison to the situation during the winter of 2013-14 when there were difficulties supplying the Midwest. Propane inventories going into the 2013-14 winter heating season were already drawn down after a large, wet corn harvest increased demand for propane to dry the corn grain. In addition, an unusually early, cold winter further increased demand, drawing propane inventories down to low levels. Since then, domestic propane production has increased, propane infrastructure and market participants have adjusted to new supply patterns, Midwest propane inventories are much higher, and total U.S. propane inventories are at the highest levels on record.
Principal contributors: Warren Wilczewski, Mason Hamilton