
EIA tracking tool shows light-sweet crude oil imports to Gulf Coast virtually eliminated
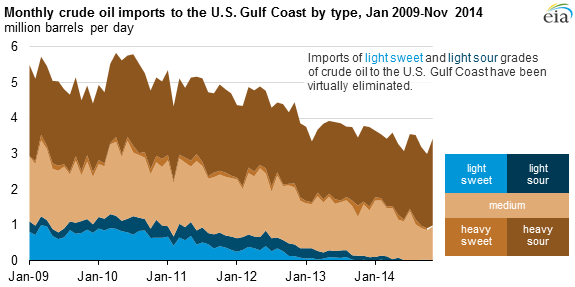
Note: Heavy crude has an API gravity <= 27. Light crude has an API gravity >= 35. Medium crude has an API gravity between 27 and 35. Sweet crude has 0.5% sulfur content or less. Sour crude has more than 0.5% sulfur content.
The increase in U.S. shale and tight crude oil production has resulted in a decrease of crude oil imports to the U.S. Gulf Coast area, particularly for light-sweet and light-sour crude oils. These trends are visualized in EIA's crude import tracking tool, which allows for time-series analysis of crude oil imported to the United States.
Historically, Gulf Coast refineries have imported as much as 1.3 million barrels per day (bbl/d) of light-sweet crude oil, more than any other region of the country. Beginning in 2010, improvements to the crude distribution system and sustained increases in production in the region (in the Permian and Eagle Ford basins) have significantly reduced light crude imports. Since September 2012, imports of light-sweet crude oil to the Gulf Coast have regularly been less than 200,000 bbl/d. Similarly, Gulf Coast imports of light crude with higher sulfur content (described as light-sour) have declined and have been less than 200,000 bbl/d since July 2013.
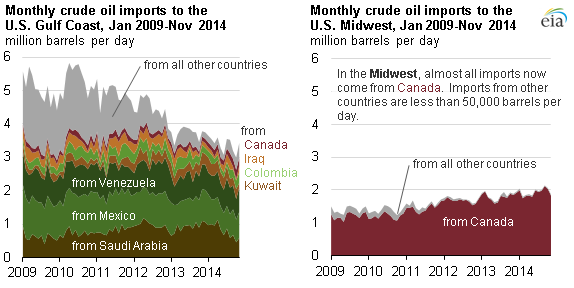
EIA's crude oil import tool can be used to examine crude oil imports by country of origin. In the Gulf Coast (defined as the Petroleum Administration for Defense District 3, or PADD 3), crude oil is imported from several countries, mainly in the Americas (Mexico, Venezuela, Colombia, and Canada) and in the Middle East (Saudi Arabia, Kuwait, and Iraq). Imports from other countries to PADD 3 have declined significantly in recent years, from an average of 1.7 million bbl/d in 2009 to just 0.26 million bbl/d in 2014, through October. Imports from Africa in particular have declined, as those were primarily light-sweet in quality.
Because the Midwest region (PADD 2) is landlocked, imports show a much less diverse range of countries of origin. In 2014, almost all imports of crude oil to the Midwest came from Canada. Comparing Canadian imports to the Midwest, which now surpass 2 million bbl/d, imports from other countries had been historically low (125,000 bbl/d in 2009) and are now even lower (34,000 bbl/d in 2014 through October).
Note: The import tool is currently in Beta mode for public testing and comment. Feedback on the tool can be provided directly on the page.
Principal contributors: Jozef Lieskovsky, Richard Yan