
Rail deliveries of oil and petroleum products up 38% in first half of 2012
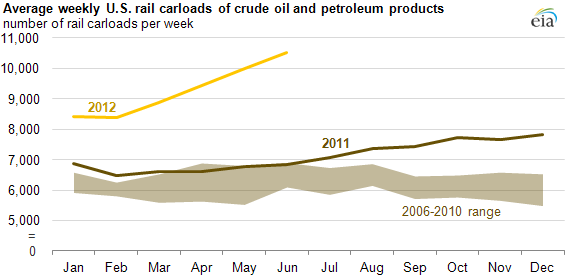
Note: Crude oil and petroleum products rail shipments do not include ethanol.
Railroads are playing a more important role in transporting U.S. crude oil to refineries, especially oil production from North Dakota's Bakken formation where there is limited pipeline infrastructure to move supplies. The amount of crude oil and petroleum products transported by U.S. railways during the first half of 2012 increased 38% from the same period in 2011, according to industry data.
The number of rail tanker cars hauling crude oil and petroleum products totaled close to 241,000 during January-June 2012 compared to 174,000 over the same period in 2011, according to the Association of American Railroads (AAR). Rail deliveries of crude oil and petroleum products in June alone jumped 51% to 42,000 tanker cars from a year earlier to an average weekly record high of 10,500 tanker cars for the month.
One rail tanker car holds about 700 barrels. This would be equivalent to about 927,000 barrels per day (bbl/d) of oil and petroleum products shipped, on average, during the first half of 2012 versus 673,000 bbl/d in the same period in 2011, and June 2012 shipments were almost 980,000 bbl/d.
In 2009, crude oil accounted for 3% of the combined deliveries in the oil and petroleum products category tracked by AAR. The trade group estimates crude oil now accounts for almost 30% of the rail deliveries in this category, and says that crude oil is responsible for nearly all of the recent growth.
Much of the growth in shipping oil by rail is due to the rise in North Dakota's oil production, which has more than tripled in the last three years. North Dakota surpassed California in December 2011 to become the third biggest oil producing state and took over the number two spot from Alaska in March 2012.
Most crude oil is moved in the United States by pipeline. However, because of limited pipeline infrastructure in North Dakota's Bakken region, oil producing companies there rely on rail to move their barrels. Shipping oil by rail costs an average $10 per barrel to $15 per barrel nationwide, up to three times more expensive than the $5 per barrel it costs to move oil by pipeline, according to estimates from Wolfe Trahan, a New York City-based research firm that focuses on freight transportation costs. Wolfe Trahan also notes that using rail tank cars allows oil producers to separate grades of crude more easily and ensure their purity than when different oils are mixed in a pipeline.
Argus Media reports that rail rates for unit trains moving Bakken oil to major refining centers on the Gulf Coast are about $12.75 per barrel to St. James, Louisiana and $12.25 per barrel to Port Arthur, Texas. The unit train delivery rate to New York Harbor is around $15 per barrel.
BNSF is the biggest railway mover of U.S. crude, transporting one-third of Bakken oil production alone with unit trains carrying up to 85,000 barrels of oil. The company's carloadings of crude oil and petroleum products increased 60% during the first six months of 2012.