U.S. Energy Information Administration logo
Skip to sub-navigation
April 12, 2012

Global natural gas consumption doubled from 1980 to 2010
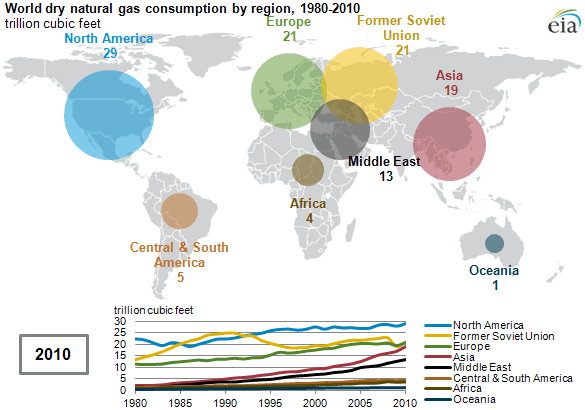
animated map of World petroleum consumption by region, 1980-2010
Source: U.S. Energy Information Administration, International Energy Statistics.

Between 1980 and 2010, global consumption of dry natural gas rose from 53 trillion cubic feet (Tcf) to 113 Tcf. Although consumption in North America saw the slowest regional growth in percentage terms (29%) from 1980 to 2010, the region accounted for more than 25% of the world's natural gas consumption during all years in the period. The Middle East had the highest growth rate, increasing more than ten-fold from 1.3 Tcf in 1980 to 13.2 Tcf in 2010.

Unlike petroleum, trends in regional natural gas consumption and production are more similar because of the limited role played by inter-continental movements of natural gas, at least until recently. For example, global LNG shipments rose from 6.7 Tcf to 10.5 Tcf between 2005 and 2010, or 58%, according to BP's Statistical Review of World Energy (2011 report). Between 2009 and 2010, global LNG shipments were up 23%.

Asia had the second-highest growth rate, increasing more than eight-fold from 2.2 Tcf to 19.2 Tcf over the three decades. By 2010, Asian natural gas demand approached the level of Europe and the Former Soviet Union.
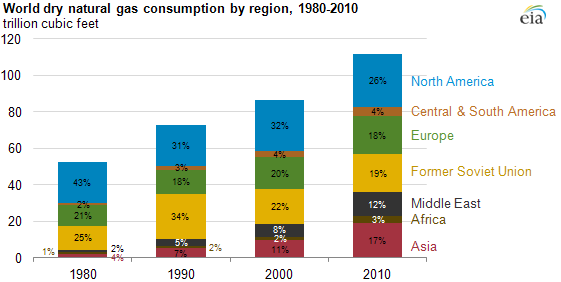
graph of World natural gas consumption by region, 1980-2010, as described in the article text
Source: U.S. Energy Information Administration, International Energy Statistics.
Note: Percents on graph represent that region's share of global dry natural gas consumption in that year. Percents do not sum to 100% for each year because the graph does not include Oceania, which only accounted for 1% of global consumption each year.
Download CSV Data

Future growth in each region will depend on economic growth rates, natural gas production trends, differences in natural gas prices across regions, and future energy and environmental policies.

Statistics
Analysis
Tools
Education
News

Petroleum & Other Liquids

Crude oil, gasoline, heating oil, diesel, propane, and other liquids including biofuels and natural gas liquids.

Natural Gas

Exploration and reserves, storage, imports and exports, production, prices, sales.

Electricity

Sales, revenue and prices, power plants, fuel use, stocks, generation, trade, demand & emissions.

Coal

Reserves, production, prices, employment and productivity, distribution, stocks, imports and exports.

Nuclear & Uranium

Uranium fuel, nuclear reactors, generation, spent fuel.

Renewable & Alternative Fuels

Includes hydropower, solar, wind, geothermal, biomass and ethanol.

EIA Survey Forms

Forms EIA uses to collect energy data including descriptions, links to survey instructions, and additional information.

Total Energy

Comprehensive data summaries, comparisons, analysis, and projections integrated across all energy sources.

U.S. States

State energy information, including overviews, rankings, data, and analyses.

International

International energy information, including overviews, rankings, data, and analyses.

Environment

Greenhouse gas data, voluntary reporting, electric power plant emissions.

Data Tools, Apps, & Maps

Tools to customize searches, view specific data sets, study detailed documentation, and access time-series data.

Open Data

EIA's free and open data available as API, Excel add-in, bulk files, and widgets

EIA Beta

Come test out some of the products still in development and let us know what you think!

Open Source Code

EIA's open source code, available on GitHub.

RSS Feeds

Subscribe to feeds for updates on EIA products including Today in Energy and What's New.