Global natural gas production doubled between 1980 and 2010
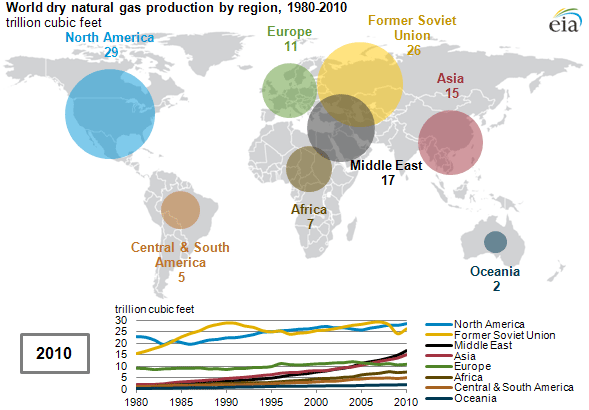
Note: Natural gas production represented by dry natural gas production.
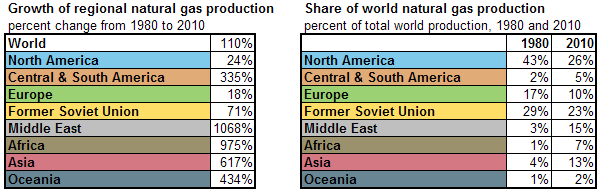
Global dry natural gas production increased 110% between 1980 and 2010, from 53 trillion cubic feet (Tcf) in 1980 to 112 Tcf in 2010. The combined share of North America and the Former Soviet Union—the top two producing regions during the time period—fell from 72% in 1980 to 49% in 2010. While all regions increased natural gas production between 1980 and 2010, the Middle East grew most rapidly, increasing more than eleven-fold.
Note: Natural gas production represented by dry natural gas production.
Download CSV Data
Natural gas production in the United States has grown rapidly in the past several years. Rapid increases in U.S. natural gas production from shale gas formations resulted from widespread application of two key technologies: horizontal drilling and hydraulic fracturing.
Shale gas resources, which have recently provided a major boost to U.S. natural gas production, are also available in other regions of the world. An initial assessment of 48 shale gas basins in over 30 foreign countries includes 5,760 Tcf of technically recoverable shale gas resources.