
LNG-exporting Gulf Coast states drove U.S. natural gas demand growth
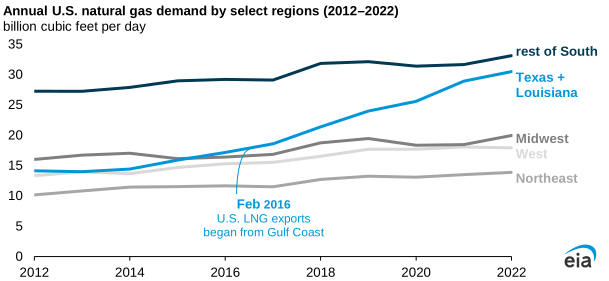
Note: Demand=domestic consumption (residential, commercial, industrial, electric power) plus gross exports. LNG=liquefied natural gas.
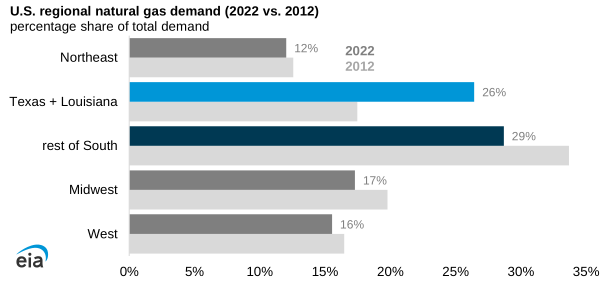
U.S. natural gas demand (domestic consumption plus gross exports) increased 43%, or 34.5 billion cubic feet per day (Bcf/d), from 2012 to 2022. Demand in the Gulf Coast states of Louisiana and Texas grew by 116%, or 16.0 Bcf/d, driven largely by increased demand for feedgas for liquefied natural gas (LNG) exports. U.S. LNG exports began in 2016 with the startup of the Sabine Pass LNG export terminal in Louisiana. Other terminals in both states began exporting LNG soon after, prompting most of the growth in natural gas demand.
Increased natural gas-fired electric power generation was the second-most significant factor in natural gas demand growth because of coal-to-gas switching and rising demand for air conditioning. Total natural gas demand in the Midwest grew by 35% between 2012 and 2022 because natural gas consumption in the electric power sector more than doubled during this period, increasing by 2.3 Bcf/d. In the Northeast, natural gas demand grew by 36% between 2012 and 2022, also driven by increased consumption in the electric power sector.
Natural gas consumption in the electric power sector increased almost every year in the last five years because summers have gotten warmer, which has increased air-conditioning demand. The summer months last year were the third warmest on record in the United States, resulting in increased demand for air conditioning and higher natural gas-fired electric power generation in the U.S. Lower 48 states.
The rest of the South (excluding Louisiana and Texas) consumes the most natural gas of any region in the United States and has the highest natural gas consumption in the industrial and electric power sectors. The Northeast and West consume the least natural gas in the United States, at about 12.2 Bcf/d each in 2022. When adding in pipeline exports from the West to Mexico, the West accounts for a larger share of total U.S. demand than the Northeast.
Principal contributor: Katy Fleury