
U.S. liquefied natural gas exports have increased as new facilities come online
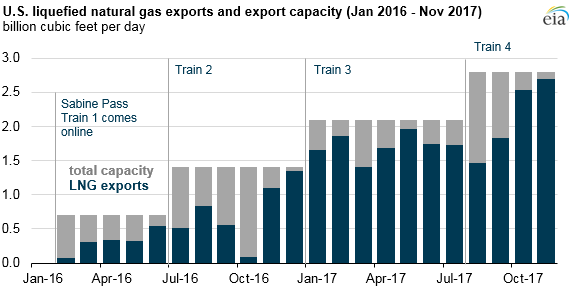
In August 2017, total U.S. natural gas liquefaction capacity in the Lower 48 states increased to 2.8 billion cubic feet per day (Bcf/d) following the completion of the fourth liquefaction unit at the Sabine Pass liquefied natural gas (LNG) terminal in Louisiana. With increasing liquefaction capacity and utilization, U.S. LNG exports averaged 1.9 Bcf/d, and capacity utilization averaged 80% this year, based on data through November.
Sabine Pass, located on the U.S. Gulf Coast near the Louisiana-Texas border, consists of four existing natural gas liquefaction units, or trains, with a fifth train currently under construction. When complete, Sabine Pass will have a total liquefaction capacity of 3.5 Bcf/d. Five additional LNG projects are currently under construction in the United States, and they are expected to increase total U.S. liquefaction capacity to 9.6 Bcf/d by the end of 2019:
- Cove Point liquefaction terminal (one train, 0.75 Bcf/d capacity) in Maryland is 97% complete, and Dominion Energy expects to place it in service before the end of 2017.
- Elba Island LNG (10 modular liquefaction trains, 0.03 Bcf/d capacity each) in Georgia is owned by Kinder Morgan. Six trains are scheduled to come online in the summer of 2018, and four trains are scheduled to come online by May 2019.
- Freeport LNG (three trains, 0.7 Bcf/d capacity each) in Texas is being developed by Freeport LNG Development, L.P. The first train is expected to come online in November 2018, with the remaining two trains following in six-month intervals.
- Corpus Christi (two trains, 0.6 Bcf/d capacity each) in Texas is being developed by Cheniere and is expected to come online in 2019.
- Cameron LNG (three trains, 0.6 Bcf/d capacity each) in Louisiana is being developed by Sempra LNG and is expected to come online in 2019.
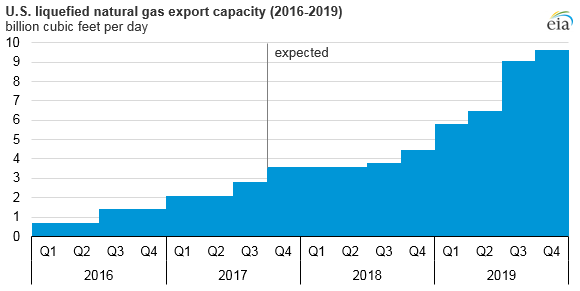
Overall utilization of existing LNG liquefaction facilities is expected to average 80% in 2017 and 79% in 2018, based on LNG export projections in EIA’s latest Short-Term Energy Outlook. Several factors can affect utilization rates, including weather-related disruptions, demand fluctuations, seasonality in import markets, production schedules for new LNG facilities, and maintenance on existing facilities.
At Sabine Pass, the ramp-up process, combined with maintenance on Train 1, resulted in capacity utilization for Trains 1 and 2 averaging 51% in 2016. Capacity increased in 2017 with the addition of Trains 3 and 4, but the ramp-up periods for those trains, as well as lower spring demand in markets in Asia and Europe and disruptions caused by Hurricane Harvey in August, limited total utilization.
Exports from Sabine Pass began to increase in September 2017 as Train 4 ramped up to full production—reaching 2.7 Bcf/d in November—with an overall capacity utilization rate of 96% across four trains. Utilization at Sabine Pass is projected to remain well above 90% in winter 2017–2018 as a result of expected strong natural gas winter demand and high spot LNG prices in Asia and Europe.
Principal contributors: Victoria Zaretskaya, Kristen Tsai