
August 7, 2014
Energy production and other mining account for a large percentage of some state economies
Source: U.S. Commerce Department, Bureau of Economic Analysis (BEA), Regional Economic Accounts
Note: BEA uses the value-added approach to estimate industrial contribution to GDP by state, or gross state product, presenting industrial value-added output by state based on the North American Industry Classifications System (NAICS). Mining comprises establishments that extract naturally occurring mineral solids, such as coal and ores, crude petroleum, and natural gas. The data are converted to real (2009$) GDP by state by applying national chain-weighted price deflators.
Note: BEA uses the value-added approach to estimate industrial contribution to GDP by state, or gross state product, presenting industrial value-added output by state based on the North American Industry Classifications System (NAICS). Mining comprises establishments that extract naturally occurring mineral solids, such as coal and ores, crude petroleum, and natural gas. The data are converted to real (2009$) GDP by state by applying national chain-weighted price deflators.
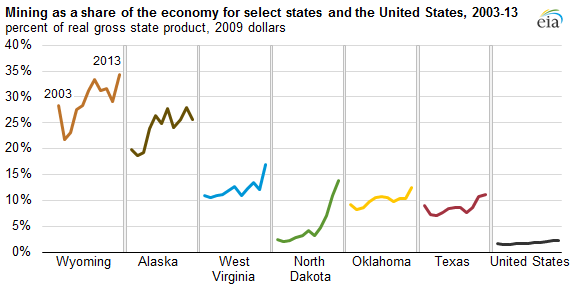
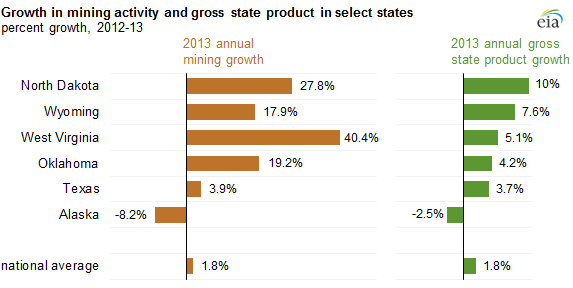
At the national level, establishments that extract crude oil and natural gas as well as naturally occurring mineral solids, such as coal and ores, collectively referred to as the mining sector in economic data, accounted for about 2% of the U.S. economy last year. In some states, though, the mining sector accounts for a much larger share of the economy. Of the six states where mining comprised more than 10% of the state's economy in 2013, mining growth resulted in five of those states having higher economic growth than the national average.
- Wyoming. With crude oil and natural gas production from the Niobrara formation and coal mining from the Powder River Basin, Wyoming derives a larger share of its economic output from mining than any other state. In 2013, Wyoming's economic output from mining grew 18% between 2012 and 2013.
- Alaska. Alaska has the second-largest share of its economy tied to mining activity. An 8% decrease in mining activity in 2013, reflecting a drop in oil production from the North Slope, contributed to the decline of Alaska's total GDP by 2.5% in 2013, the largest decline in the nation.
- West Virginia. Most of West Virginia's mining activity is from coal mining, but natural gas production from the Marcellus shale in West Virginia has increased in recent years. The sector grew from 11% of total economic activity in 2003 to 17% in 2013.
- North Dakota. In percentage terms, North Dakota has experienced more change in its economic makeup from mining activity than any other state, going from 2% of its economy in 2003 to 14% in 2013. North Dakota's crude oil production surpassed 1 million barrels per day in average monthly oil production earlier this year, because of production in the Bakken region. Associated effects from Bakken development, such as growth in construction, real estate rental and leasing, and accommodation and food services, also increased economic output. Growth in the mining sector has helped North Dakota achieve the lowest unemployment rate in the nation at 2.7% as of June.
- Oklahoma. Oklahoma has significant oil and natural gas production, ranking fifth nationally in the volume of crude oil production and fourth in natural gas production. The state saw 19% growth in mining activity, up from its ten-year average of 7%. Oklahoma’s significant refining and transportation activity is not included in the mining sector data.
- Texas. In absolute terms, mining activity in Texas in 2013 was more than seven times greater than the next largest state, Oklahoma. But compared to the states discussed above, Texas’s economy is much larger, so mining only accounts for about 11% of its economy. Much of the recent growth in mining has come from rapidly growing oil and gas production in the Eagle Ford formation and Permian Basin.
Source: U.S. Commerce Department, Bureau of Economic Analysis (BEA), Regional Economic Accounts
Principal contributor: Robert McManmon
Tags: Alaska, mining, North Dakota, Oklahoma, production/supply, states, Texas, West Virginia, Wyoming