U.S. Energy Information Administration logo
Skip to sub-navigation
November 15, 2013

Bakken oil production forecast to top 1 million barrels per day next month
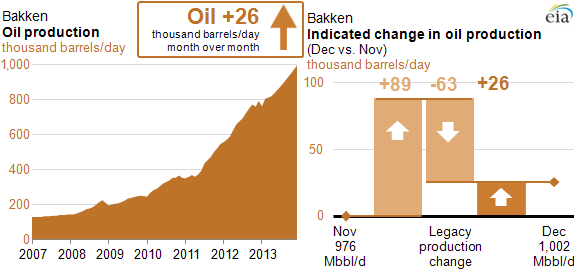
graph of Bakken oil production from DPR, as explained in the article text
Source: U.S. Energy Information Administration, Drilling Productivity Report
Note: DPR data are estimates

Republished November 15, 2013, 1:50 p.m. to correct an error in the text.

The latest monthly update of estimated crude oil production in the Bakken region of North Dakota and Montana shows total wellhead output topping 1 million barrels of oil per day (bbl/d) next month. The update appears in the most recent issue of the U.S. Energy Information Administration's Drilling Productivity Report (DPR).
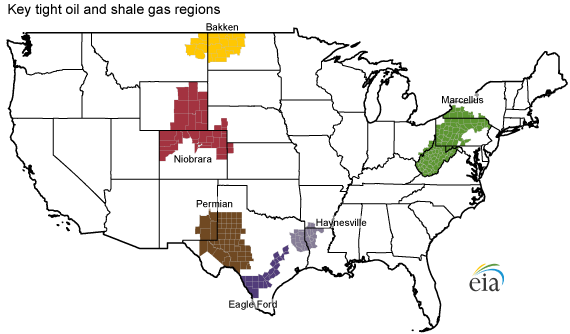
The Bakken region now accounts for a little over 10% of total U.S. oil production and is expected to be the fourth region (along with the Gulf of Mexico, Eagle Ford, and Permian basins) producing more than 1 million bbl/d in the nation in December.

Infrastructure improvements in the central part of the nation carried more of this oil to refineries in recent months, helping to narrow the price difference between the Bakken region and West Texas Intermediate, which is priced at Cushing, Oklahoma.

The growth of crude oil production in the Bakken region is part of a longer-term trend in drilling efficiency gains (see graph below) and has led North Dakota to rank second in crude oil production in the United States, behind only Texas. These production gains have led to increases in gross domestic product in the state as well as increased demand for electricity.
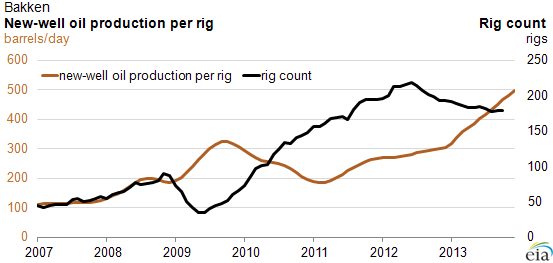
Graph of Bakken oil production per rig from DPR, as explained in the article text
Source: U.S. Energy Information Administration, Drilling Productivity Report
Note: DPR data are estimates


EIA's November DPR was released earlier this week.

Principal contributor: EIA Staff

Statistics
Analysis
Tools
Education
News

Petroleum & Other Liquids

Crude oil, gasoline, heating oil, diesel, propane, and other liquids including biofuels and natural gas liquids.

Natural Gas

Exploration and reserves, storage, imports and exports, production, prices, sales.

Electricity

Sales, revenue and prices, power plants, fuel use, stocks, generation, trade, demand & emissions.

Coal

Reserves, production, prices, employment and productivity, distribution, stocks, imports and exports.

Nuclear & Uranium

Uranium fuel, nuclear reactors, generation, spent fuel.

Renewable & Alternative Fuels

Includes hydropower, solar, wind, geothermal, biomass and ethanol.

EIA Survey Forms

Forms EIA uses to collect energy data including descriptions, links to survey instructions, and additional information.

Total Energy

Comprehensive data summaries, comparisons, analysis, and projections integrated across all energy sources.

U.S. States

State energy information, including overviews, rankings, data, and analyses.

International

International energy information, including overviews, rankings, data, and analyses.

Environment

Greenhouse gas data, voluntary reporting, electric power plant emissions.

Data Tools, Apps, & Maps

Tools to customize searches, view specific data sets, study detailed documentation, and access time-series data.

Open Data

EIA's free and open data available as API, Excel add-in, bulk files, and widgets

EIA Beta

Come test out some of the products still in development and let us know what you think!

Open Source Code

EIA's open source code, available on GitHub.

RSS Feeds

Subscribe to feeds for updates on EIA products including Today in Energy and What's New.