
Market prices for Renewable Fuel Standard credits are falling
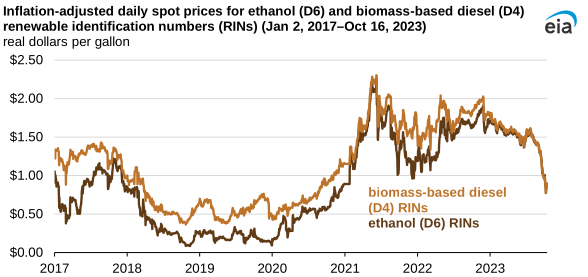
The prices of ethanol (D6) and biomass-based diesel (D4) renewable identification number (RIN) credits—the compliance mechanism used for the Renewable Fuel Standard (RFS) program administered by the U.S. Environmental Protection Agency (EPA)—each fell by more than one third between September 1 and October 16, our data shows. As of October 16, biomass-based diesel RINs (D4 RINs) were $0.90, and ethanol RINs (D6 RINs) were $0.89; both prices were more than 40 cents lower than on September 1. D4 RIN prices have not been this low since 2020, when EPA granted several small refinery exemptions that reduced fuel blending requirements and RIN prices.
To increase biofuels use, EPA sets annual targets, also called Renewable Volume Obligations (RVOs), for the amount of renewable fuels that must enter into the U.S. fuel supply. Petroleum refiners and importers of motor gasoline and diesel comply either by blending biofuels into petroleum-based fuels or by purchasing RIN credits. Ethanol production generates D6 RINs that satisfy the total biofuel obligation. Biomass-based diesel production generates D4 RINs that satisfy the biomass-based diesel, the advanced biofuel, and the total biofuel obligations.
Normally, biomass-based diesel D4 RINs trade at a premium to ethanol D6 RINs because they satisfy more RVOs. This year, the two RIN prices have moved very close together because the RVOs for biomass-based diesel and advanced biofuel were set significantly lower than production trends, meaning it will be easy for the industry to meet the RVOs.
In general, RIN credit prices are driven by two main factors: biofuels production costs, which are heavily influenced by feedstock prices, and the RFS levels set by EPA. On June 21, 2023, EPA set the RVOs for 2023–25 below biofuel production trends, putting downward pressure on prices over the summer. However, higher raw material (production) costs offset the downward pressure on prices, delaying the price declines until September.
RIN prices dropped in September as biofuel production costs declined and production levels exceeded the RVOs. Biofuel production costs, primarily the price of feedstock soybean oil, generally declined from January through May 2023, reducing RIN prices during that period. Soybean oil prices increased in June and July, largely offsetting the downward price pressures from the RFS and delaying the fall in RIN prices.
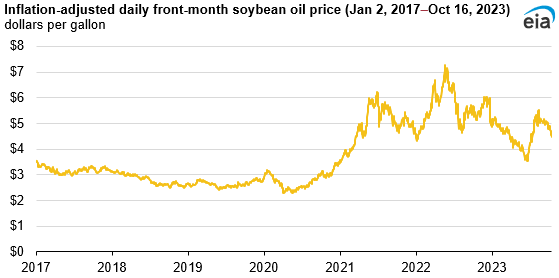
As soybean oil prices eased in September and October, RIN prices also came down.
RIN prices affect obligated parties—petroleum refiners and importers of motor gasoline and diesel—who can comply with the RFS either by blending biofuels into petroleum-based fuels or by purchasing RIN credits. RIN prices also affect biofuel producers, who can earn more money for their products when RIN prices are higher.
Principal contributor: Jimmy Troderman