
EIA expects U.S. net natural gas exports to almost double by 2021
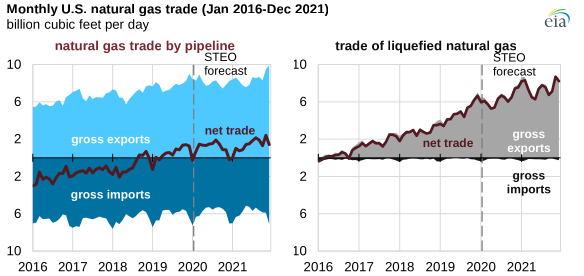
In its Short-Term Energy Outlook (STEO), released on January 14, the U.S. Energy Information Administration (EIA) forecasts that U.S. natural gas exports will exceed natural gas imports by an average 7.3 billion cubic feet per day (Bcf/d) in 2020 (2.0 Bcf/d higher than in 2019) and 8.9 Bcf/d in 2021. Growth in U.S. net exports is led primarily by increases in liquefied natural gas (LNG) exports and pipeline exports to Mexico. Net natural gas exports more than doubled in 2019, compared with 2018, and EIA expects that they will almost double again by 2021 from 2019 levels.
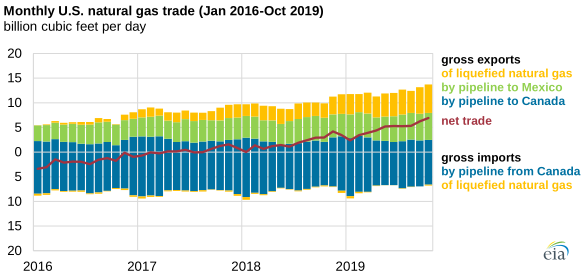
The United States trades natural gas by pipeline with Canada and Mexico and as LNG with dozens of countries. Historically, the United States has imported more natural gas than it exports by pipeline from Canada. In contrast, the United States has been a net exporter of natural gas by pipeline to Mexico. The United States has been a net exporter of LNG since 2016 and delivers LNG to more than 30 countries.
In 2019, growth in demand for U.S. natural gas exports exceeded growth in natural gas consumption in the U.S. electric power sector. Natural gas deliveries to U.S. LNG export facilities and by pipeline to Mexico accounted for 12% of dry natural gas production in 2019. EIA forecasts these deliveries to account for an increasingly larger share through 2021 as new LNG facilities are placed in service and new pipelines in Mexico that connect to U.S. export pipelines begin operations.
Net U.S. natural gas imports from Canada have steadily declined in the past four years as new supplies from Appalachia into the Midwestern states have displaced some pipeline imports from Canada. U.S. pipeline exports to Canada have increased since 2018 when the NEXUS pipeline and Phase 2 of the Rover pipeline entered service. Overall, EIA projects the United States will remain a net natural gas importer from Canada through 2050.
U.S. pipeline exports to Mexico increased following expansions of cross-border pipeline capacity, averaging 5.1 Bcf/d from January through October 2019, 0.5 Bcf/d more than the 2018 annual average, according to EIA’s Natural Gas Monthly. The increase in exports was primarily the result of increased flows on the newly commissioned Sur de Texas–Tuxpan pipeline in Mexico, which transports natural gas from Texas to the southern Mexican state of Veracruz. Several new pipelines in Mexico that were scheduled to come online in 2019 were delayed are expected to enter service in 2020:
- Pipelines in Central and Southwest Mexico (1.2 Bcf/d La Laguna–Aguascalientes and 0.9 Bcf/d Villa de Reyes–Aguascalientes–Guadalajara)
- Pipelines in Western Mexico (0.5 Bcf/d Samalayuca–Sásabe)
U.S. LNG exports averaged 5 Bcf/d in 2019, 2 Bcf/d more than in 2018, as a result of several new facilities that placed their first trains in service. This year, several new liquefaction units (referred to as trains) are scheduled to be placed in service:
- Trains 2 and 3 at Cameron LNG in Louisiana
- Train 3 at Freeport LNG in Texas
- Trains 5–10, six Moveable Modular Liquefaction System (MMLS) units, at Elba Island in Georgia
In 2021, the third train at the Corpus Christi facility in Texas is scheduled to come online, bringing the total U.S. liquefaction capacity to 10.2 Bcf/d (baseload) and 10.8 Bcf/d (peak). EIA expects LNG exports to continue to grow and average 6.5 Bcf/d in 2020 and 7.7 Bcf/d in 2021, as facilities gradually ramp up to full production.
Principal contributor: Victoria Zaretskaya