
Multiple factors push Western Europe to use less natural gas and more coal
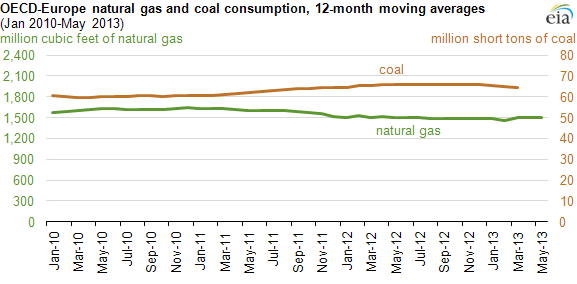
Note: Rolling figures above represent moving 12-month averages to compensate for seasonality. Coal represents gross inland consumption of hard coal, lignite, and peat. Coal consumption figures for Switzerland were unavailable and are not reflected in the OECD-Europe total.
In contrast to the United States, natural gas consumption in OECD-Europe has been generally declining since 2011, and coal consumption has been generally increasing. A confluence of supply and demand factors, in both the natural gas and coal markets, as well as other economic constraints, have contributed to this phenomenon.
OECD European gross domestic product (GDP), which grew by about 1% to 2% quarter-on-quarter through 2010 and 2011, began contracting again by the second quarter of 2012. Reduced economic activity lowered overall demand for electricity, particularly in the industrial sector. In 2011, annual natural gas consumption was 8% lower than in 2010 in OECD-Europe, while consumption of coal was 6% greater. Similarly, the region consumed 2% less natural gas and 2% more coal in 2012 than in 2011.
However, in first-quarter 2013, natural gas consumption increased 3% and coal consumption decreased 6% compared with the first three months of 2012. The latest shift in fuel consumption trends can in part be attributed to the Large Combustion Plant Directive from the European Commission, which caused a number of older coal plants to retire despite profitability, particularly in England.
Production of natural gas in OECD-Europe is declining. Production was 5% lower in 2012 than 2011, according to the European Commission. Coal production decreased less than 1% during the same period. Production decreases, along with declining natural gas imports from Russia, Norway, and Algeria, and rising coal imports from the United States and Colombiaâ€&supported by the sharp decline in global coal pricesâ€&have affected energy consumption patterns in OECD-Europe between 2011 and 2012. Electric power producers with the capability to use coal-fired generators have opted to reduce natural gas consumption. Comparing 2013 to 2012 (through late September), natural gas imports from Russia to Western Europe are up more than 30%, while imports from Norway are down about 7%, according to Bentek Energy.
Some key factors affecting natural gas and coal market prices in Europe include:
Natural gas
- Competition for LNG. China, Japan, and South Korea vie with Europe for LNG imports. The latter two countries have historically paid high prices for LNG import cargos. Following the Fukushima disaster in March 2011, Japan has been importing large volumes of LNG to compensate for idle nuclear capacity, which has driven up prices. In addition, rising demand for natural gas in China has encouraged natural gas suppliers to diversify their export portfolios.
- Pricing structure. Much of the natural gas in Europe is still priced based on oil; this is sometimes referred to as oil indexation. The European Commission estimates that about one-half of European natural gas supply is indexed to oil. Moreover, about 80% of Russian natural gas supplies to OECD Europe are linked to oil.
- Norwegian production. Norway is the largest supplier of natural gas to northwest Europe and exports almost all of the natural gas it produces. Norwegian natural gas production levels affect the prices of natural gas in OECD Europe.
- Supply disruptions. Italy and Spain import natural gas from Algeria. Italy also imports natural gas from Libya. Supply disruptions due to regional conflict affect supply and prices at destination. Recently, pipeline flows from Libya to Italy went to zero because of the Libyan civil war.
- Nonuniform pricing. Russian natural gas companies, important providers of natural gas to Europe, often set diverse prices for different European consumers, further reducing the appeal of relying on imported natural gas.
- Storage capacity availability. Pricing for natural gas is more seasonal in Europe than in the United States, and the limited availability of storage capacity can have a pronounced influence on spot prices, especially in northwest Europe.
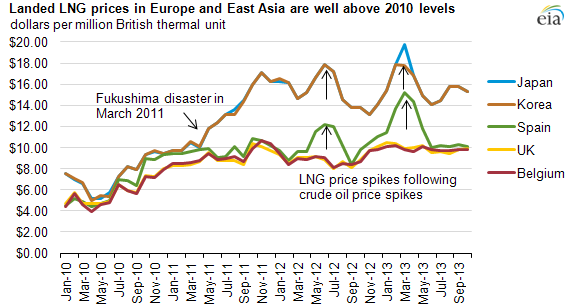
Note: Landed prices represent the price of LNG after arriving at an import terminal but before regasification and pipeline distribution, sometimes known as delivered ex ship or DES prices. October 2013 prices are estimated.
Coal
- Abundant supply: The availability of low-priced natural gas in the United States has made coal a less competitive fuel for domestic power generation. As a result, favorably priced U.S. exports of coal have been an attractive alternative to natural gas for Europeans.
- Electric power sector changes: Following the Fukushima disaster in 2011, Germany retired eight nuclear power reactors, which were replaced with a combination of increased output from renewable sources as well as coal for power generation.
- Environmental initiatives: Since coal produces more carbon per unit of heat than natural gas, coal is more affected by a high carbon price. The price of carbon in Europe is currently very low, partly because of a prolonged economic recession in Europe, so many consumers are opting for coal over natural gas. A significant increase in the price of carbon would promote more natural gas consumption and less coal consumption.
Principal contributors: Michael Kopalek and Tejasvi Raghuveer