Profile Overview
U.S Energy Atlas with total energy layers
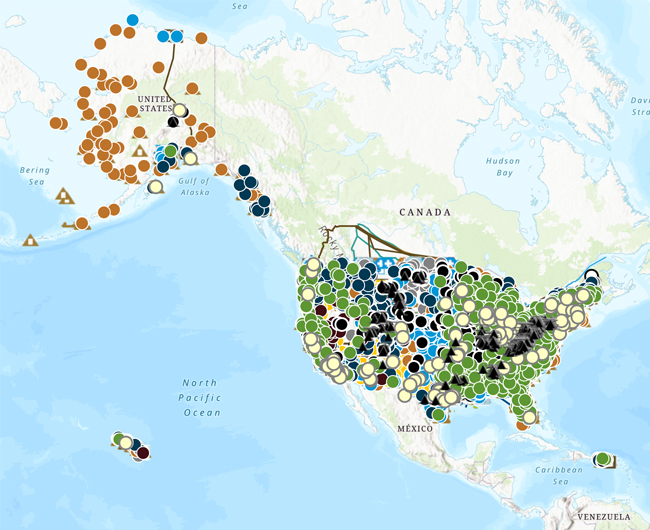 View the interactive map
 Quick Facts
- The commercial sector accounts for around three-fifths of total energy consumption in the District of Columbia, a higher share for that sector than in any state.
- The District's Renewable Portfolio Standard requires that 100% of the electricity sold in the city be from renewable sources by 2032, including at least 5.5% from solar energy.
- In 2022, solar energy generated 59% of the total small-scale and utility-scale electricity within the District, natural gas accounted for 24%, and biomass provided 17% of the city's generation.
- The District has more than three times as many public electric vehicle charging locations, about 310 in total, than it does motor gasoline stations, and the city's per capita gasoline expenditures are lower than those of any state.
- The District consumed less electricity in 2022 than all but four states, but its per capita total electricity use is the 13th highest compared to the states. About 98% of the electricity consumed in the city is generated in other states.
Last Updated: January 18, 2024