Release Date: February 7, 2023
STEO Between the Lines: How is the mix of fuels used to produce electricity in the United States changing?
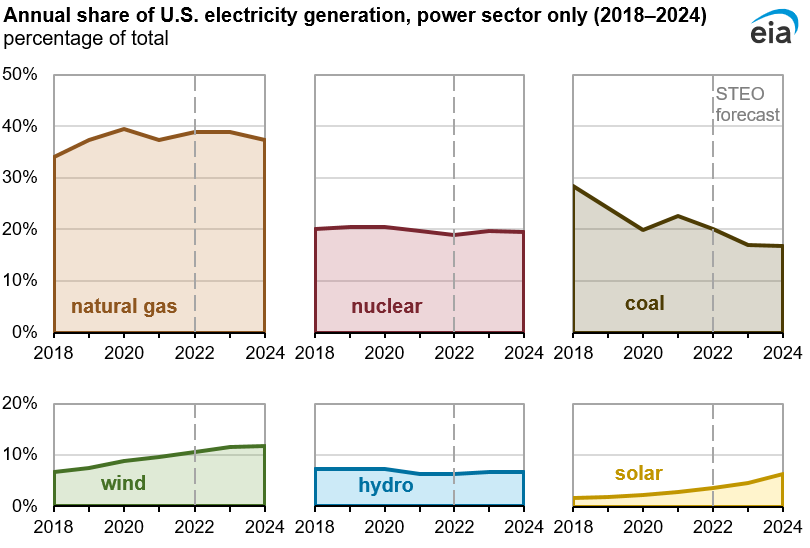
Data values: U.S. electricity generation
Note: The six energy sources shown accounted for at least 98% of annual electricity generation from the electric power sector during this time period.
We expect that new renewables capacity—mostly wind and solar—will reduce electricity generation from both coal-fired and natural gas-fired power plants in 2023 and 2024. Renewable generation capacity additions in our STEO are less uncertain than other forecasts because we survey this information monthly. However, the electricity actually generated from both renewable and nonrenewable sources varies based on weather conditions and market dynamics. It’s this aspect of our STEO electricity generation forecast where most of the uncertainty lies.
Wind and solar accounted for 14% of U.S. electricity generation in 2022. In our February Short-Term Energy Outlook, we forecast that wind and solar will rise slightly, accounting for 16% of total generation in 2023 and 18% in 2024. Electricity generation from coal falls from 20% in 2022 and to 17% in both 2023 and 2024. Natural gas accounted for 39% of electric power sector electricity generation last year, and we forecast its share to be similar in 2023 then fall to 37% in 2024.
Electricity generation from renewable energy sources has been growing steadily in the United States over the past decade. Last year, electric power generation from all types of renewables accounted for nearly one-quarter of total generation by the U.S. electric power sector.
Renewables' output tends to follow capacity additions
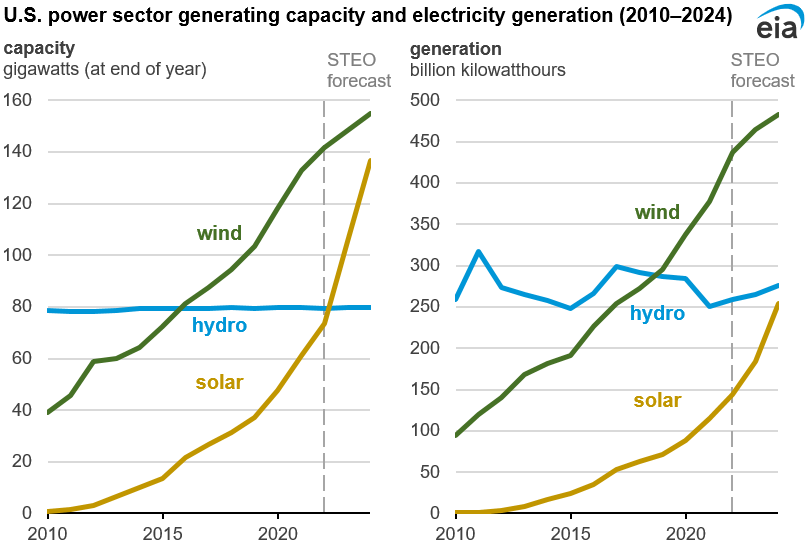
Data values: U.S. generating capacity, U.S. electricity generation
The increase in renewables generation is being driven primarily by investment in new solar and wind generating capacity. The U.S. electric power sector operated about 73 gigawatts (GW) of solar photovoltaic (PV) capacity at the end of 2022. Power generators are reporting plans to expand solar capacity by 43% (32 GW) in 2023, which would be the largest percentage increase in solar capacity since 2016. Solar capacity will increase an additional 30% (31 GW) in 2024.
We expect U.S. wind capacity to increase 5% in each of the next two years, 6 GW in 2023 and 7 GW in 2024. Many solar and wind projects tend to come online in December, so these capacity additions tend to have the most impact on generation in the following year.
We compile information about existing and future capacity on our Preliminary Monthly Electric Generator Inventory, which is based on our monthly survey. When companies report plans for future capacity on these surveys, the projects are generally already in the development process. Although projects may experience delays, the majority of projects reported as future builds eventually come online.
We forecast coal generation to decline this year because the power sector is starting out 2023 with about 5% (11 GW) less coal-fired capacity than at the beginning of 2022. U.S. natural gas-fired capacity rose by 3 GW over the past year, but that represents a less than 1% increase. Unlike electricity generation from renewable sources, generation from natural gas and coal are more affected by relative fuel costs.
Sources of uncertainty: weather and fuel costs
Two leading factors that make our electricity forecasts especially uncertain are future weather and fuel costs. Our forecast uses temperature outlooks from the National Oceanic and Atmospheric Administration. Temperatures directly affect overall electricity demand.
Electricity demand typically peaks in the summer when homes and businesses use air conditioning. Over the last 10 years, July 2020 saw the most monthly population-weighted U.S. cooling degree days at 397 cooling degree days; the most heating degree days were in January 2014, at 971 heating degree days. Electricity demand increases less during winter months because about 40% of U.S. households use electricity for their primary space heating needs.
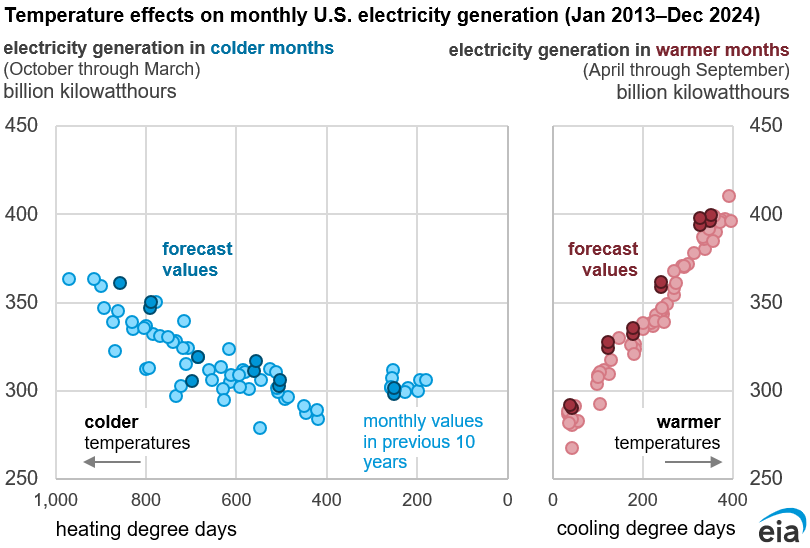
Data values: U.S. electricity generation, Weather data
Variability in weather also leads to uncertainty in renewable generation. Our forecast assumes historically typical operating conditions for wind and solar, but weather conditions can cause output from both sources to vary significantly. Similarly, variations in precipitation can lead to uncertainty in hydropower generation. In 2021, California’s drought caused the state’s hydropower output to fall 48% below the previous 10-year average. More recently, precipitation along the West coast increased snowpack, which will likely lead to higher-than-normal hydroelectric generation in California this year.
Natural gas prices are one of the primary factors that determines generation levels from existing coal and natural gas-fired power plants. Natural gas prices have also been one of the most uncertain aspects of the STEO forecast. In the past two months, the daily spot price of Henry Hub natural gas ranged from $7.20 per million British thermal units (MMBtu) in mid-December to $2.65/MMBtu at the end of January.
In our current outlook we forecast the Henry Hub price to rise slightly throughout 2023, from $3.05/MMBtu in February to $4.11/MMBtu in December. However, if natural gas prices are higher than we expect, natural gas-fired generation could decline and coal generation could remain relatively flat.